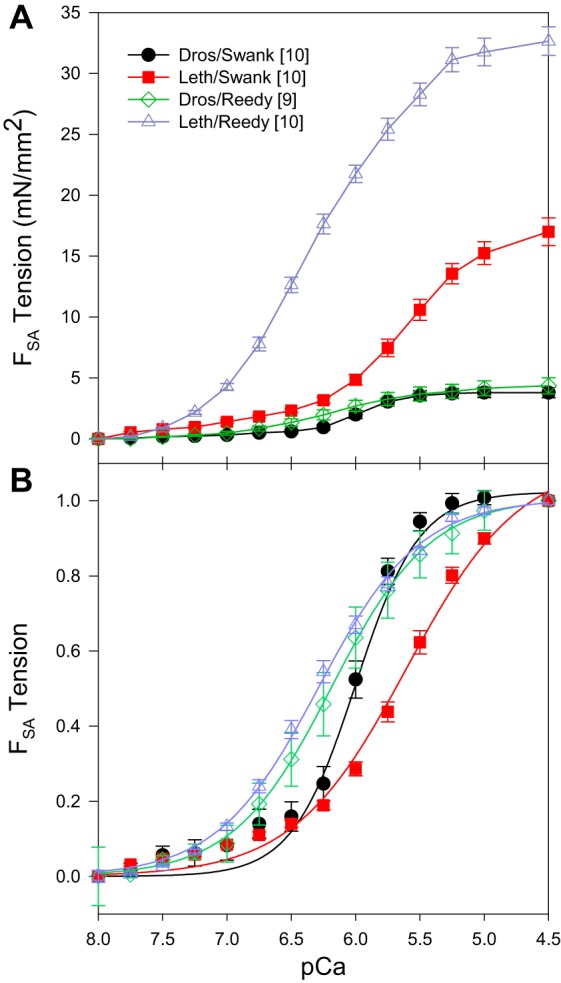
Fig. 3.

A: effect of calcium concentration on SA tension (FSA). pCa 8.0 has been set to zero so that only cross-bridges are responsible for the tension shown. B: Hill fits of the average of each data set. FSA tension values normalized to 1 at pCa 4.5. Square brackets in the legend indicate number of fibers tested. Error bars are SE.
