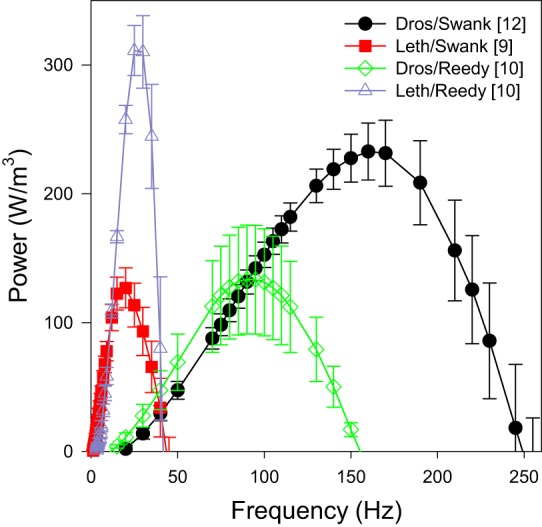
Fig. 5.

Power generated by Drosophila and Lethocerus fibers at pCa 5.0. Power was measured by oscillating the muscle length by 0.125% in a sinusoidal pattern over a range of frequencies: 0.5 to 650 Hz for Drosophila and 0.5 to 500 Hz for Lethocerus. Frequencies that did not generate positive power are not shown. Square brackets in the legend indicate number of fibers tested. Error bars are SE.
