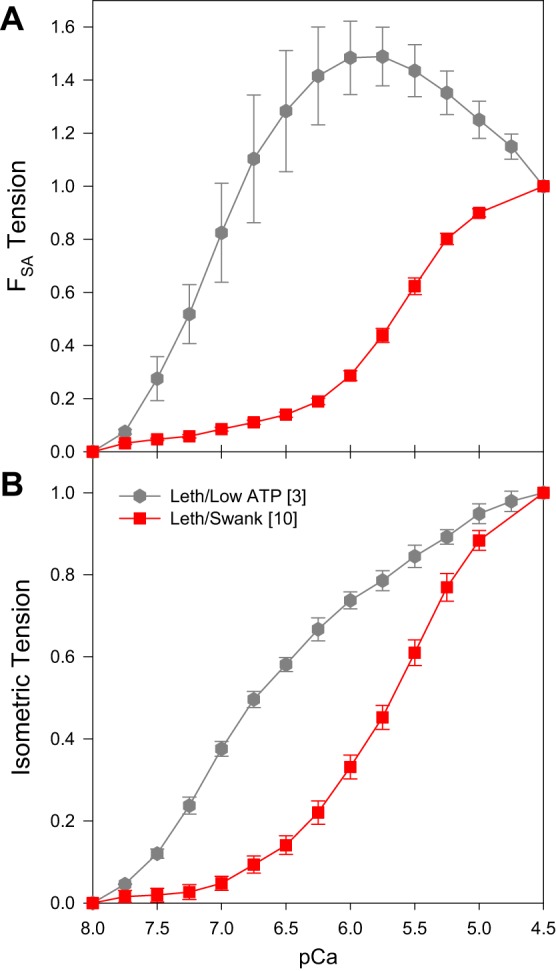
Fig. 6.

High FSA at intermediate calcium concentrations in Lethocerus fibers. This result was induced by decreasing [ATP] to 5 mM, decreasing ionic strength to 50 mM, setting fiber starting length 2% above just taut, not including an ATP regeneration system, and raising the bathing solution temperature to 20°C (gray hexagons). For comparison, we copied the Lethocerus in Swank solution plots from Figs. 1B and 3B into these graphs (red squares). All tension values were normalized to 1 at pCa 4.5. A: SA tension (FSA) versus calcium concentration. B: isometric tension (P0) versus calcium concentration. Square brackets in the legend indicate number of fibers tested. Error bars are SE.
