Fig. 3.
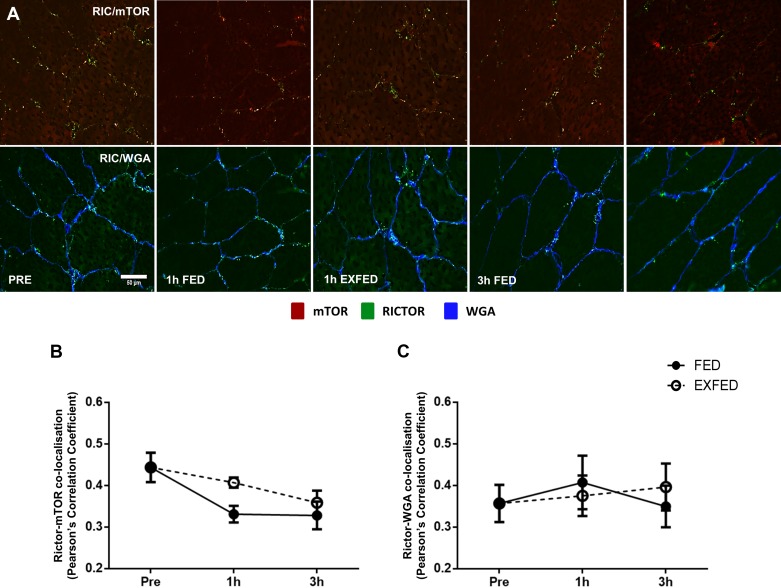
The effect of resistance exercise and/or protein carbohydrate feeding on Rictor-mTOR and Rictor-WGA colocalization. A: representative images of Rictor-mTOR and Rictor-WGA colocalization at rest, and following resistance exercise and/or protein-carbohydrate feeding. Orange/yellow regions denote areas of Rictor localization with mTOR on top row. mTOR-positive staining is shown in red, Rictor-positive in green, and WGA-positive in blue. B and C: quantification of Rictor-mTOR (B) and Rictor-WGA (C) colocalization at each time point. Scale bars, 50 µm. Data presented as means ± SE.

