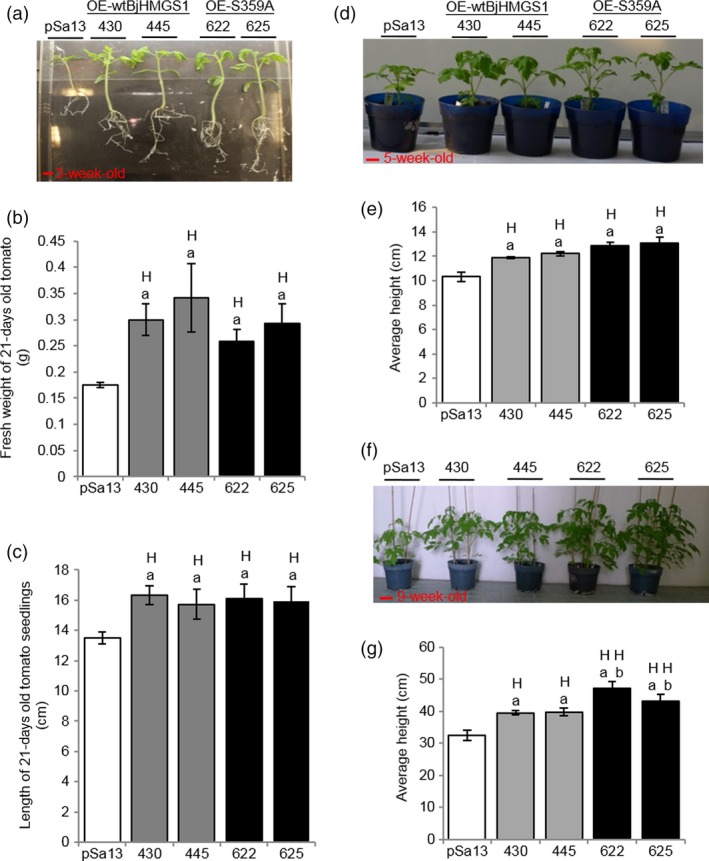
Figure 2.

Comparison in growth between 3‐, 5‐, 9‐week‐old tomato HMGS‐OE seedlings/plants and vector‐transformed control. Two independent lines each of OE‐wtBjHMGS1 (430 and 445) and OE‐S359A (622 and 625) lines were compared to the vector‐transformed control (pSa13). (a) Representative MS plate‐grown seedlings photographed 3 weeks after germination. Bar = 1 cm. (b) Statistical analysis on fresh weight of 3‐week‐old tomato seedlings. (c) Statistical analysis on length of 3‐week‐old tomato seedlings. (d) Representative greenhouse‐grown plants photographed 5 weeks after germination. Bar = 3 cm. (e) Statistical analysis on height of 5‐week‐old tomato plants. (f) Representative greenhouse‐grown plants photographed 9 weeks after germination. Bar = 6 cm. (g) Statistical analysis on height of 9‐week‐old tomato plants. Values are mean ± SD (n = 30); bars are SD; H, value higher than the control; L, value lower than the control. ‘a’ indicates significant difference between HMGS‐OE and the vector (pSa13)‐transformed control; ‘b’ indicates significant difference between OE‐wtBjHMGS1 and OE‐S359A (P < 0.01, Student's t‐test).
