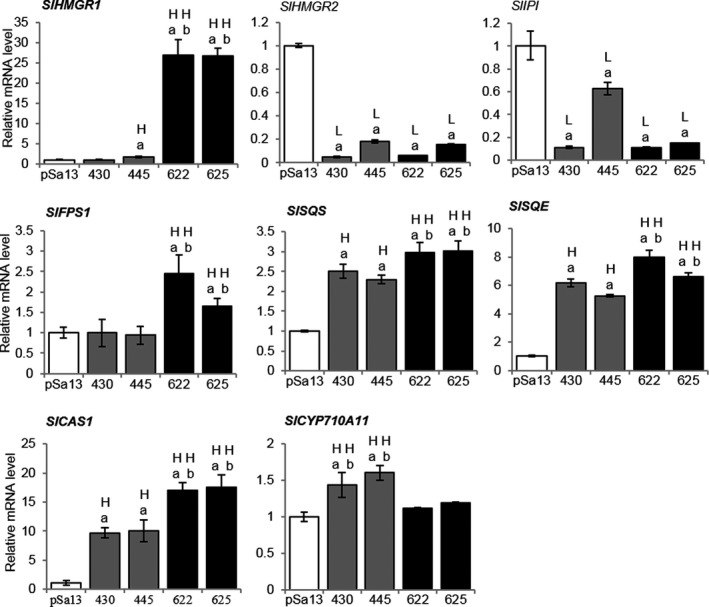
Figure 3.

QRT‐PCR analysis on the expression of MVA‐ and phytosterol‐related genes in tomato HMGS‐OE seedlings. Total RNA was extracted from 3‐week‐old tomato seedlings of the vector (pSa13)‐transformed control, OE‐wtBjHMGS1 lines (430 and 445) and OE‐S359A lines (622 and 625). H, value higher than the control; L, value lower than the control. Values are means ± SD (n = 3). ‘a’ indicates significant difference between HMGS‐OE and the vector (pSa13)‐transformed control; ‘b’ indicates significant difference between OE‐wtBjHMGS1 and OE‐S359A (P < 0.05, Student's t‐test).
