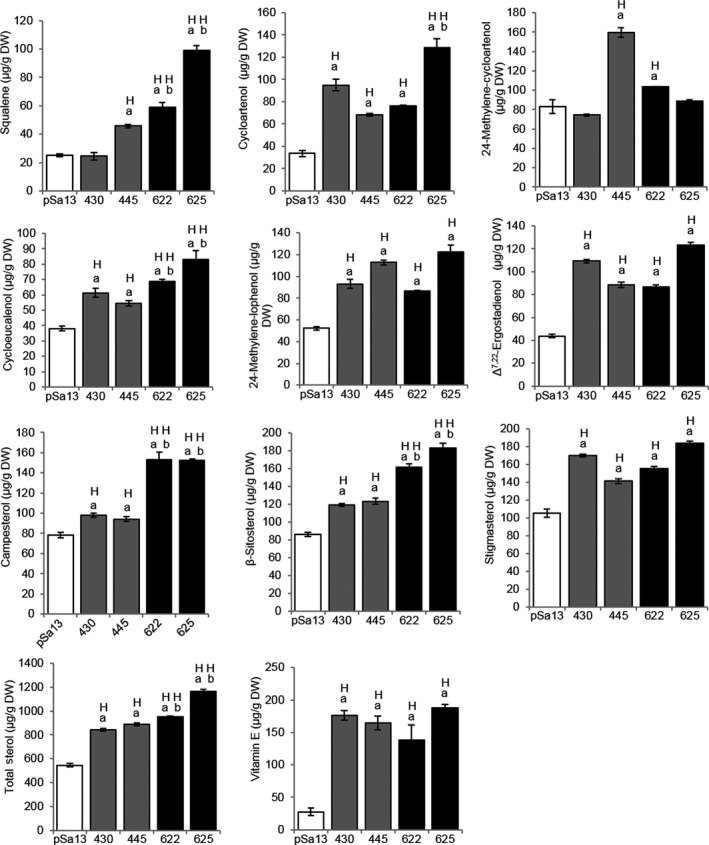
Figure 5.

GC‐MS analysis of squalene, sterol‐related intermediate, sterol and vitamin E contents [μg/g dry weight (DW)] in 57 DAP mature tomato HMGS‐OE fruits. Lipids were extracted from the vector‐transformed control (pSa13), two independent lines of OE‐wtBjHMGS1 (430 and 445) and two independent lines of OE‐S359A (622 and 625). H, value higher than the control (P < 0.01, Student's t‐test); L, value lower than the control (P < 0.01, Student's t‐test). Values are mean ± SD (n = 8); bars are SD; ‘a’ indicates significant difference between HMGS‐OE and the vector (pSa13)‐transformed control; ‘b’ indicates significant difference between OE‐wtBjHMGS1 and OE‐S359A (P < 0.01, Student's t‐test).
