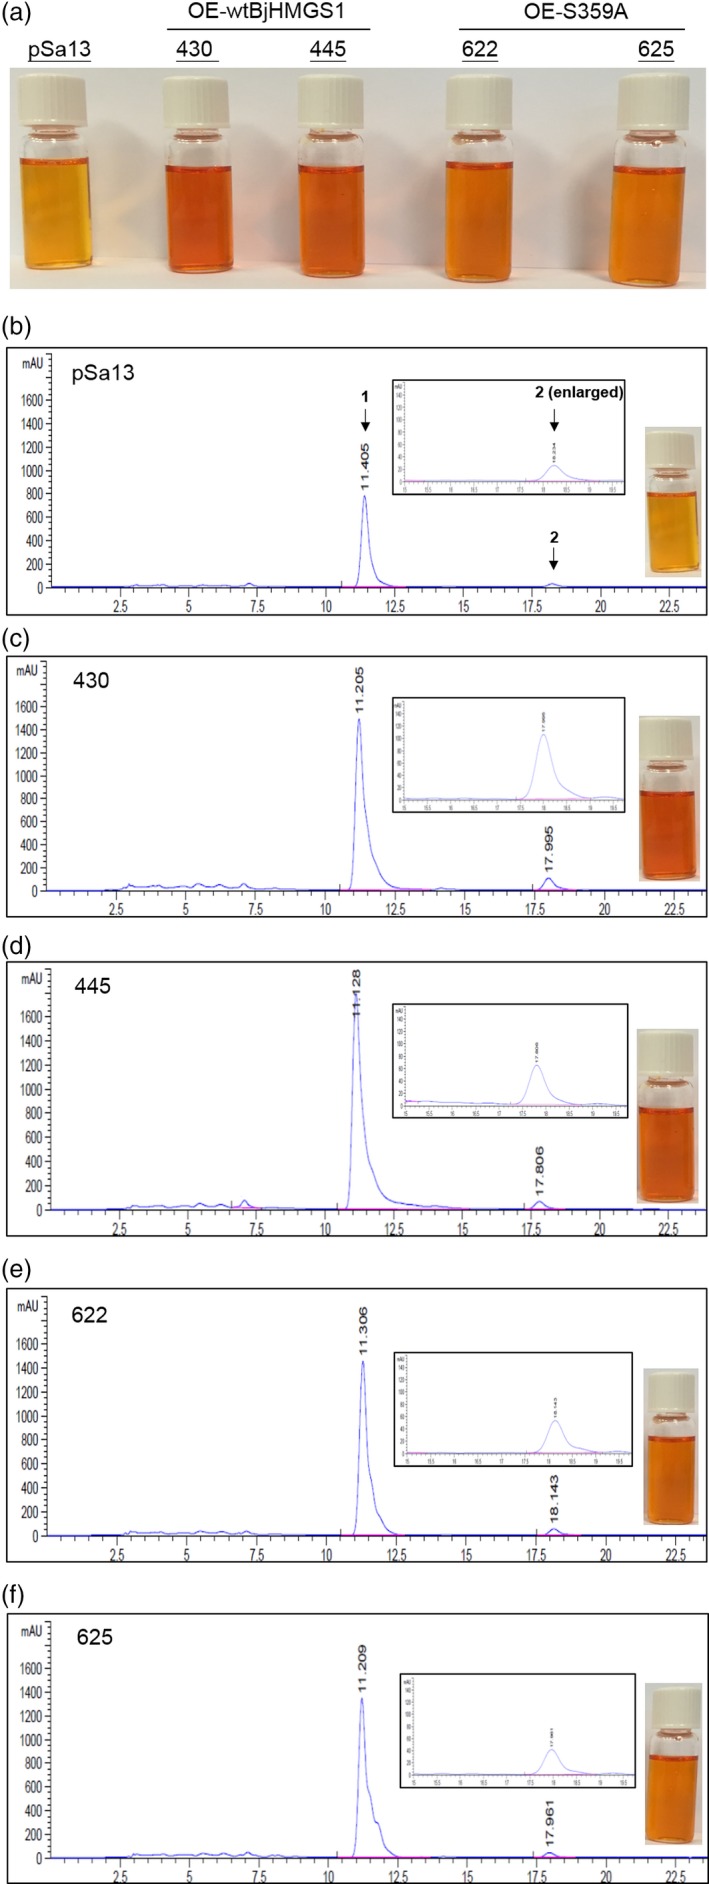
Figure 6.

HPLC analysis of carotenoid content [μg/g dry weight (DW)] in 57 DAP mature tomato HMGS‐OE fruits. Carotenoids were extracted from the vector‐transformed control (pSa13), two independent lines of OE‐wtBjHMGS1 (430 and 445) and two independent lines of OE‐S359A (622 and 625). (a) Photographs of carotenoid extracts dissolved in chloroform; (b–f) HPLC chromatograms of carotenoids from pSa13, OE‐wtBjHMGS1 (430 and 450) and OE‐S359A (622 and 625), respectively. Peak 1, lycopene; peak 2, β‐carotene. The enlarged HPLC chromatogram of peak 2 and photograph of carotenoid extract dissolved in chloroform from each sample is presented in b–f.
