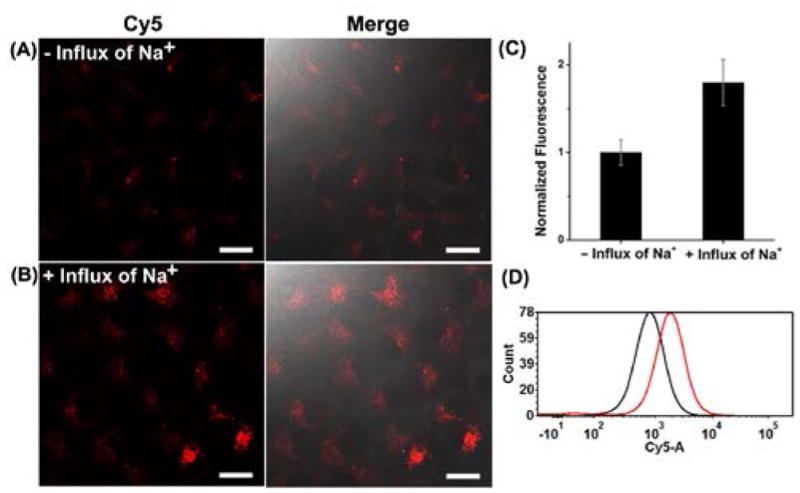
Figure 4.

Confocal images of HeLa cells transfected with active caged NaA43 DzCHA probe without (A) or with (B) influx of 50 mM Na+. (C) The mean fluorescence intensity was measured using 10 confocal images for each condition. (D) Flow cytometry assay of the cells without or with influx of 50 mM Na+. 10,000 cells were counted for each sample. Black line represents the sample without influx of Na+, red line represents the sample with influx of Na+.
