Fig. 8.
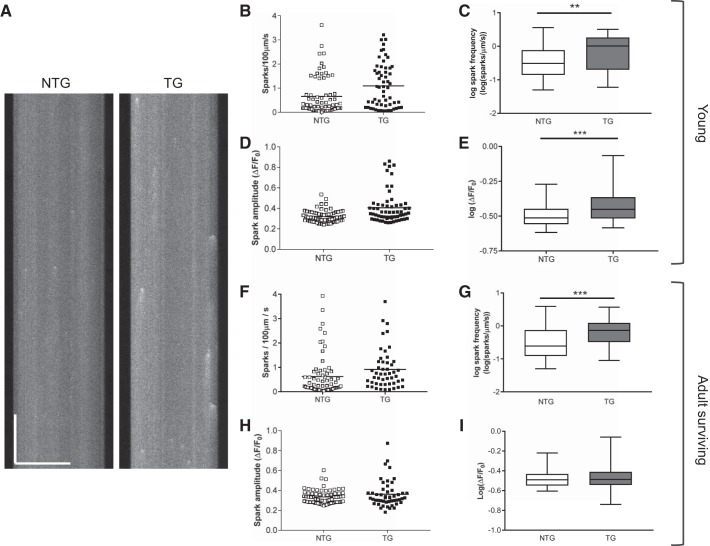
Spark properties of cardiac myocytes isolated from young and adult transgenic (TG) and nontransgenic (NTG) hearts. A: typical line scan recordings of Ca2+ sparks in young NTG and TG cells. Horizontal scale bar = 50 μm, vertical scale bar = 500 ms. Scatter graphs of data for spark frequency and spark amplitude for young cells are shown in B and D with their corresponding log transforms in C and E. Bars on the scatter graphs indicate the means of these data. The log transforms are plotted with boxes (25th–75th percentiles) and whiskers (entire range of data points). The line in the box signifies the median. B–E: data from young hearts. NTG: 68 myocytes isolated from 5 hearts; TG: 60 myocytes isolated from 4 hearts. ***P < 0.001 and **P < 0.01, t-test. F–I: data from adult hearts. The graphs are laid out in an identical way. Scatter graphs of data for spark frequency and spark amplitude for adult cells are shown in F and G with their corresponding log transforms in H and I. NTG: 70 myocytes isolated from 5 hearts; TG: 49 myocytes isolated from 3 hearts. ***P < 0.001, t-test.

