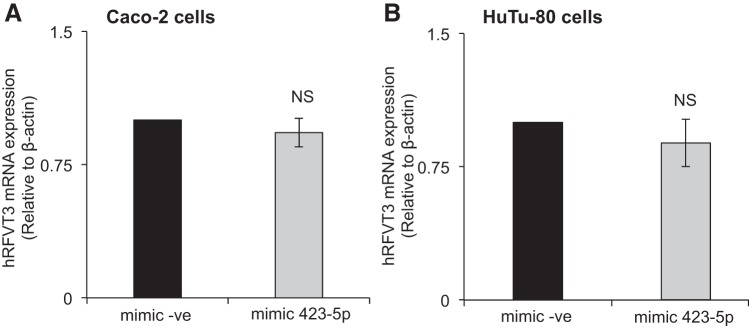
Fig. 7.
Effect of miR-423-5p mimic transfection on hRFVT3 mRNA expression levels. Relative hRFVT3 mRNA expression levels in Caco-2 (A) and HuTu-80 (B) cells; total RNA was extracted from cells transfected with mimic (negative control mimic or mimic-423-5p); then hRFVT3 mRNA levels were measured by quantitative real-time PCR as described in materials and methods. Values of mRNA levels for hRFVT3 were normalized against hβ-actin mRNA levels. Data are expressed as means ± SE of 3–5 independent experiments.

