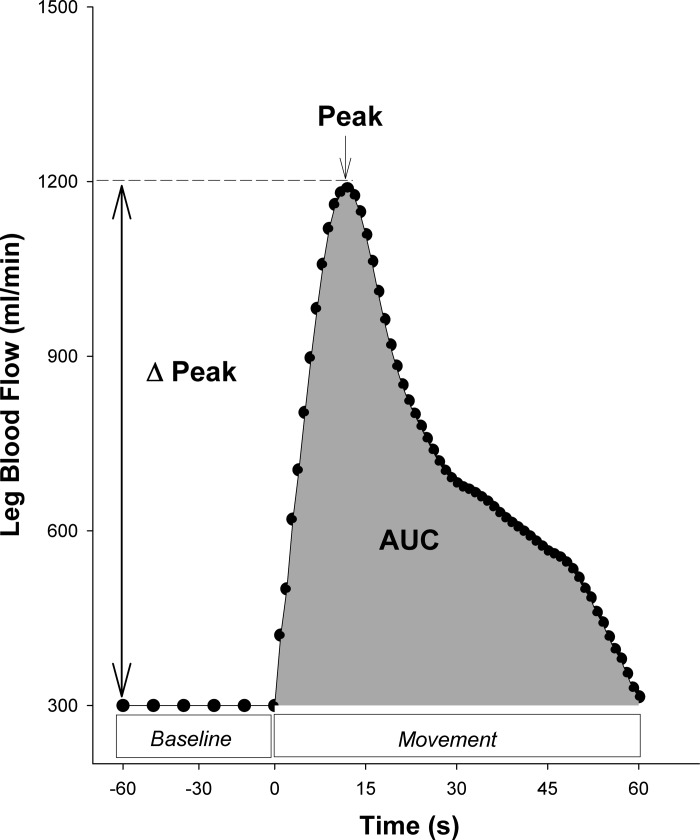
Fig. 6.
An illustration of the calculations to assess a passive leg movement (PLM) test of vascular function. Blood flow during the initial baseline period represents the average resting leg blood flow for the ≥60 s immediately before leg movement. Peak blood flow represents the greatest blood flow measured during PLM. Δ Peak blood flow represents the change from baseline to peak blood flow. Area under the curve (AUC) represents the overall PLM-induced hyperemia above baseline.

