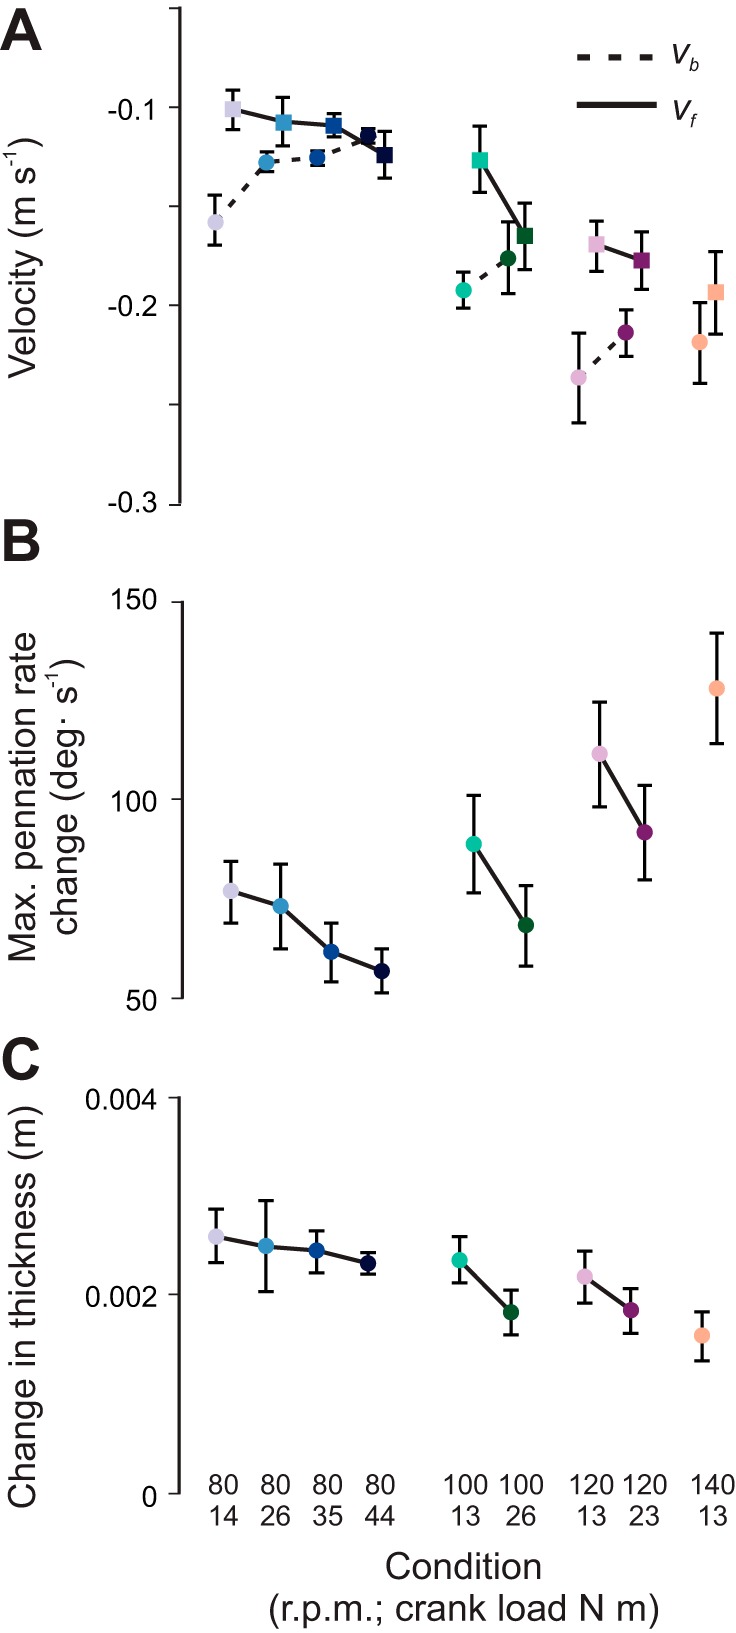
Fig. 5.

Changes in muscle belly and fascicle behavior across the range of conditions tested in this study. A: variation in maximum muscle belly-shortening velocity (vb; circles, dashed lines) and fascicle shortening velocity (vf; squares, solid lines). B: rate of pennation angle change. C: change in muscle thickness. Data are presented as means ± SE for 10 subjects.
