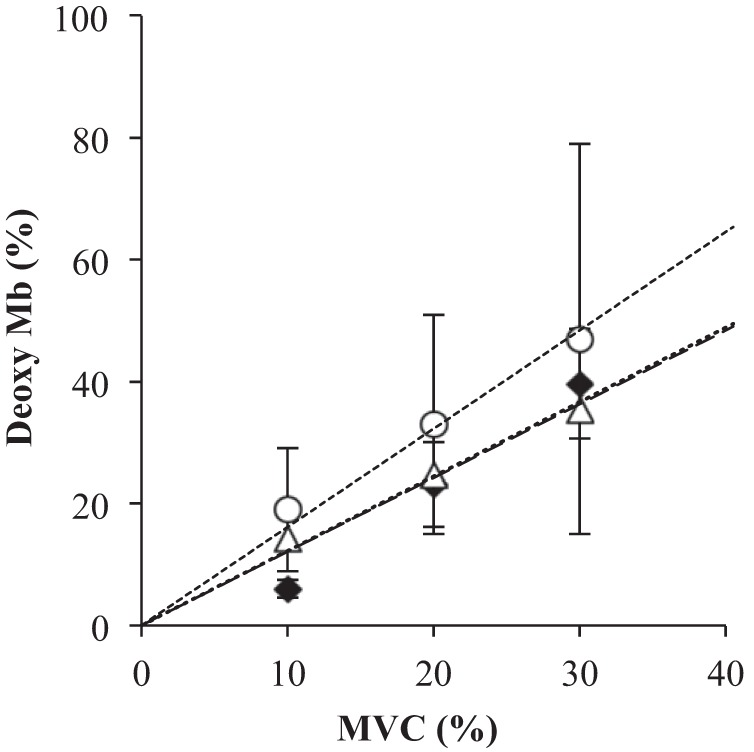
Fig. 7.

A plot of DMb vs. %MVC: the relationship between %MVC and DMb based on the NMR, DMb based on the uncorrected NIRS signal, and DMb based on the corrected NIRS signal, which assumes an upper estimate of a 20% DHb contribution. The analysis yields the following linear regression results: NMR, y = 1.22x, r2 = 0.95 (◆); uncorrected NIRS, y = 1.61x, r2 = 0.99 (○); and corrected NIRS, y = 1.21x, r2 = 0.99 (△). y = DMb, x = %MVC.
