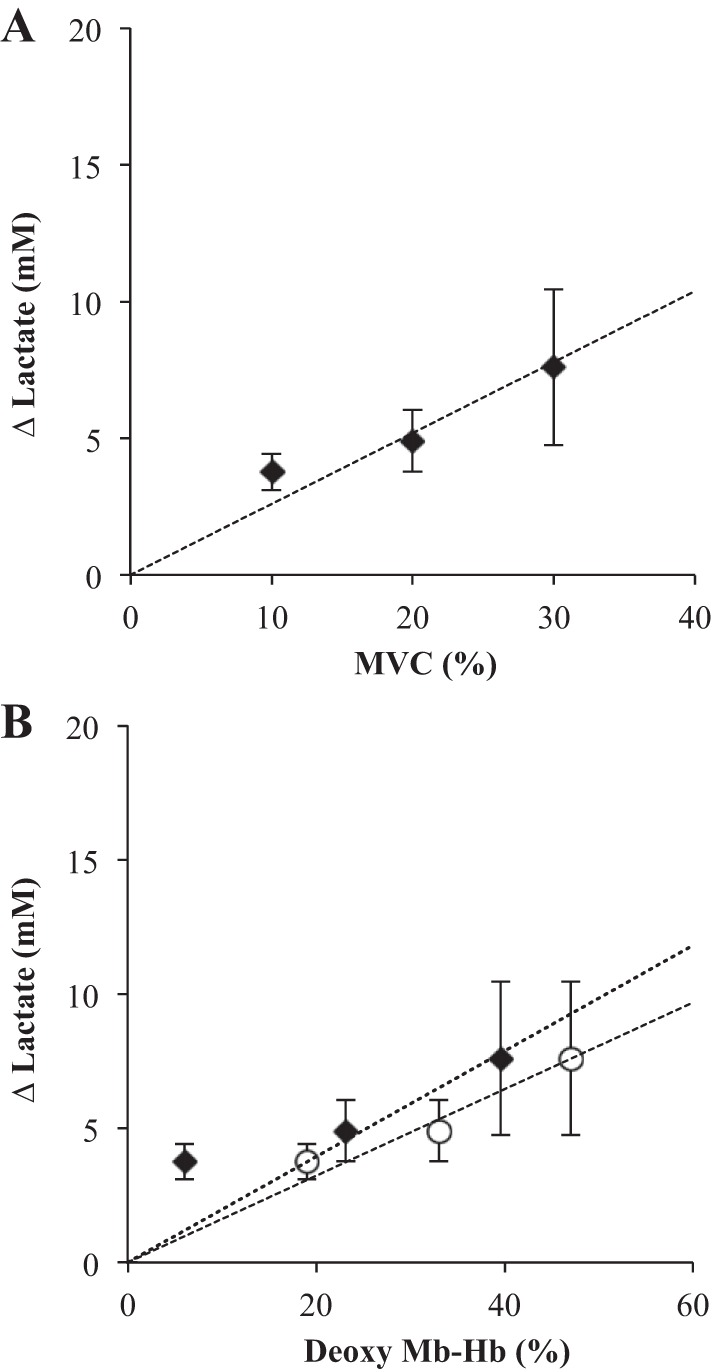
Fig. 8.

A: a plot of the lactate change relative to its resting state concentration (ΔLac) vs. %MVC: Linear regression of ΔLac vs. %MVC yields y = 0.26x, r2 = 0.95. B: a plot of the lactate change relative to its resting state concentration (ΔLac) vs. Deoxy Mb-Hb: Linear regression of ΔLac and Deoxy Mb-Hb based on the uncorrected NIRS signal yields y = 0.16x, r2 = 0.97 (○). The regression of ΔLac and DMb based on the NMR signal shows y = 0.20x, r2 = 0.77 (◆). Excluding the first Mb point, the line fit yields y = 0.20x, r2 = 0.99.
