Fig. 4.
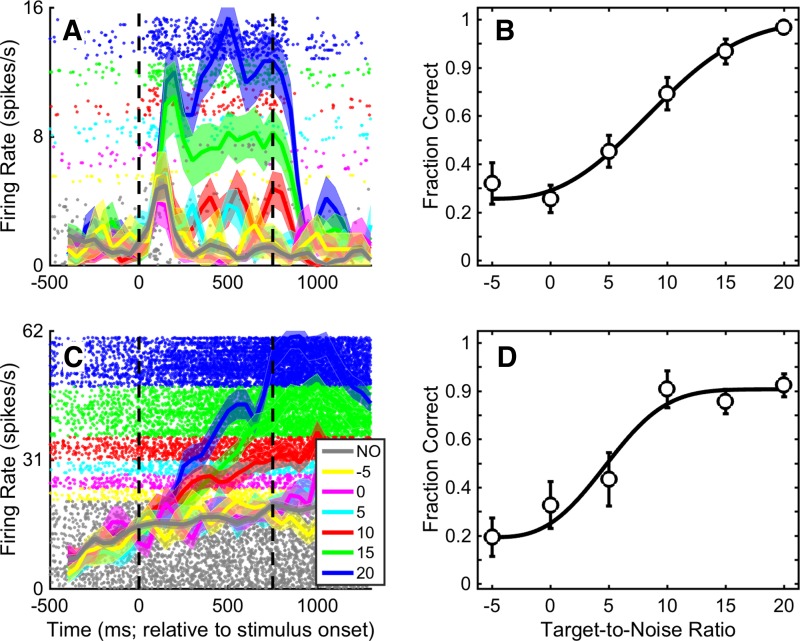
Example A1 neurons whose firing rate was increased with TNR. Shown are data for 2 different A1 neurons whose firing rate was modulated relatively smoothly by TNR. A and C: raster plot and peristimulus time histogram for each neuron. Dots indicate the time of occurrence of action potentials relative to stimulus onset (time 0). Solid thick lines indicate the mean instantaneous firing rate (shading indicates ±SE) in 100-ms bins that advance by 50 ms. Colors correspond to different values of TNR from target-in-noise hit trials; gray indicates noise-only (NO) correct-rejection trials. Vertical dashed lines indicate stimulus onset and offset, respectively. B and D: neurometric curve for each corresponding neuron. Each curve plots the fraction of trials in which an ideal observer could use the neuron’s firing rate to correctly detect the target stimulus as a function of TNR. The curves were obtained from firing rate data averaged over the 750-ms stimulus period. Error bars indicate SD. The solid black line is the maximum-likelihood fit of the neurometric data to the integral of the Weibull function (Quick 1974).

