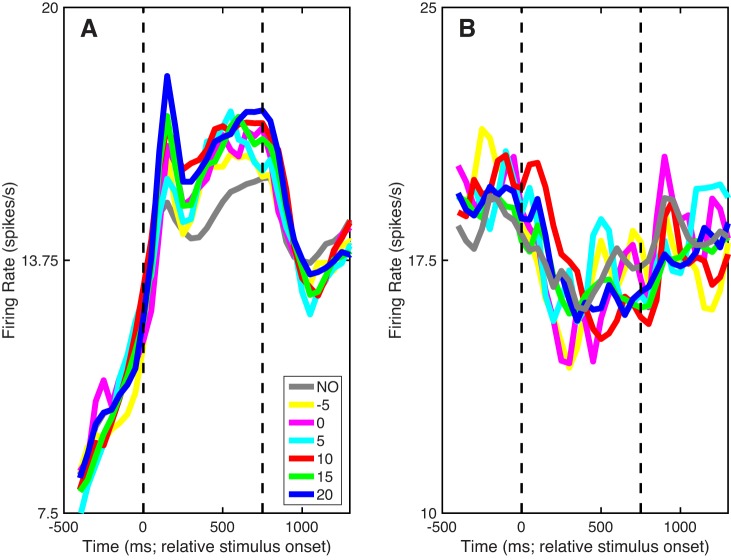
Fig. 6.
Population activity. A and B: population peristimulus time histograms relative to stimulus onset. Solid lines indicate mean firing rate. Colors correspond to different values of TNR from target-in-noise hit trials; gray indicates noise-only (NO) correct-rejection trials. Vertical dashed lines indicate stimulus onset and offset, respectively. Data in A are from “excited” A1 stimulus-responsive neurons (i.e., those whose firing rate increased with stimulus onset). Data in B are from “suppressed” A1 stimulus-responsive neurons (i.e., those whose firing rate decreased with stimulus onset).

