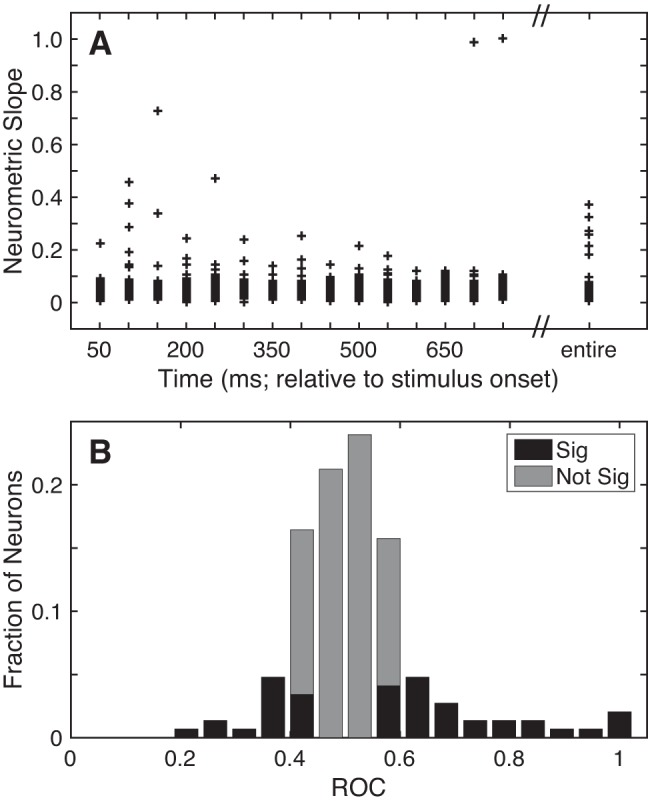
Fig. 7.

Selectivity of A1 responses. A: neurometric sensitivity to TNR. Sensitivity was defined as the slope (Δfraction correct/ΔTNR) of each neuron’s neurometric function from the 25% and 75% detection choice points. Neurometric sensitivity is shown as a scatter plot as a function of time (relative to stimulus onset) using 50-ms bins of data that advanced in 50-ms increments, as well as the entire 750-ms stimulus period (far right). B: discriminability between “signal” and “noise”. The discriminability between the firing rates elicited on signal and noise trials was calculated with an ROC ideal-observer analysis on a neuron-by-neuron basis. Bar graph shows the distribution of ROC values. Black bars indicate those neurons with significant (Sig) ROC values (2-tailed permutation test, H0: ROC value = 0.5, P < 0.05). Gray bars indicate those that did not have significant (Not Sig) ROC values (2-tailed permutation test, H0: ROC value = 0.5, P > 0.05).
