Fig. 8.
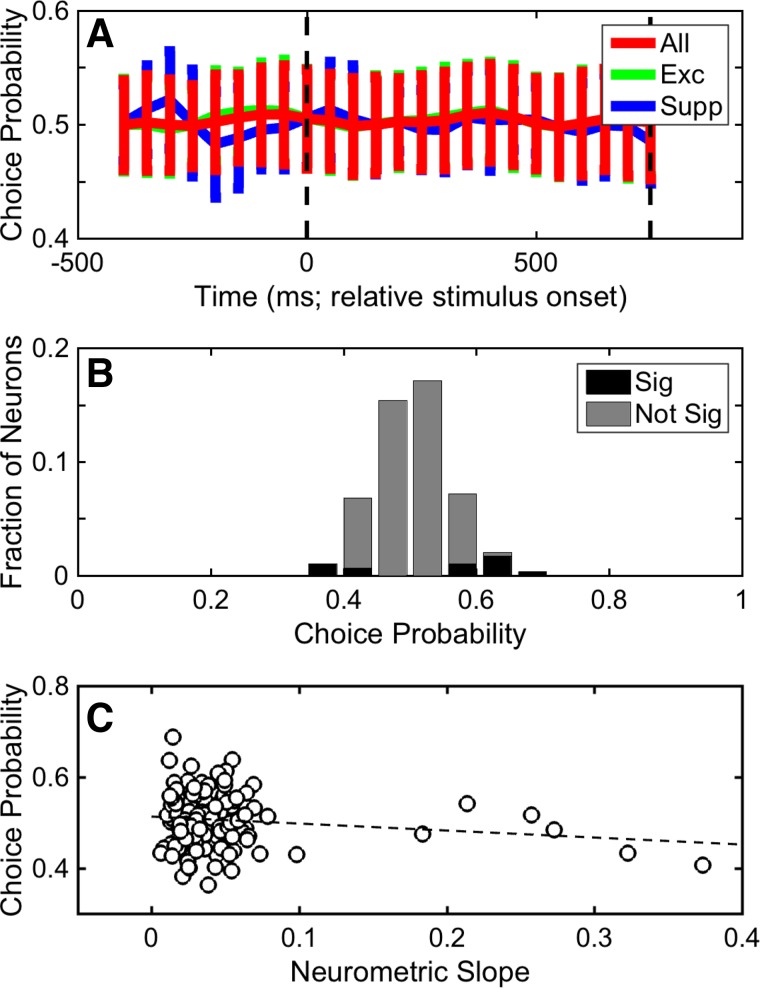
Distribution of choice probability. Distribution of choice probabilities was calculated as a function of time (A) and over the entire 750-ms stimulus period (B). A: data were calculated using firing rates that were binned into 100-ms bins that advance in 50-ms increments. Each data point is the mean choice-probability value, and error bars indicate SD. Choice probability was calculated independently using the entire set of A1 stimulus-responsive neurons (red), the subpopulation of excited stimulus-responsive neurons (green), and the subpopulation of suppressed stimulus-responsive neurons (blue). B: black bars indicate the fraction with significant (Sig) choice-probability values (2-tailed permutation test, H0: choice probability = 0.5, P < 0.05). Gray bars indicate the fraction that did not have significant (Not Sig) choice-probability values (2-tailed permutation test, H0: choice probability = 0.5, P > 0.05). C: neurometric slope (Δfraction correct/ΔTNR) is correlated with choice-probability value on a neuron-by-neuron basis. Dashed line shows the correlation line between these two values; this correlation was not significant (Spearman r = −0.042; P > 0.05). The slope values were generated from data collected over the entire 750-ms stimulus period; see Fig. 7.

