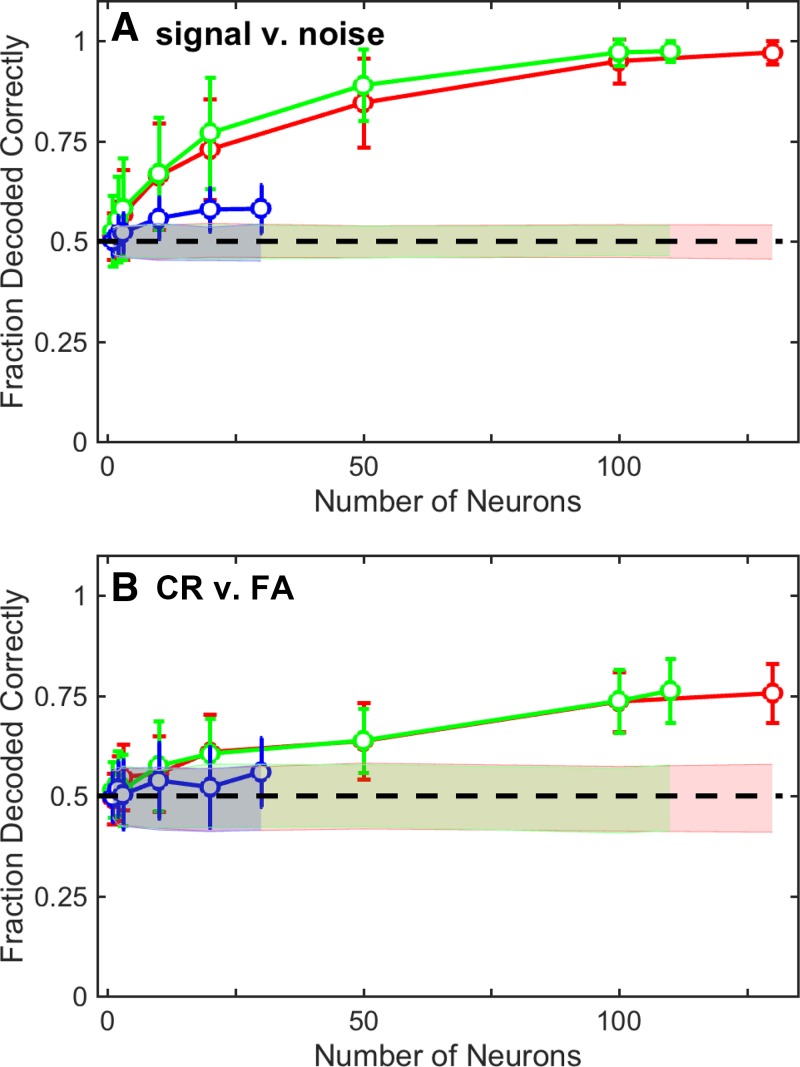
Fig. 9.
Population analysis of A1. A decoding analysis (linear classifier) quantified how well increasingly larger populations of A1 neurons encoded “signal” (i.e., the distribution of firing rates generated during target-in-noise hit trials across all TNRs) vs. “noise” (i.e., the distribution of firing rates generated during noise-only correct-rejection trials) (A) and choice [correct rejections (CR) vs. false alarms (FA); B]. Independent decoding analyses were conducted using the entire set of A1 stimulus-responsive neurons (red), the subpopulation of excited neurons (green), and the subpopulation of suppressed neurons (blue). Circles indicate the mean performance of each classifier (i.e., the fraction of times that the classifier correctly classified the test data); error bars indicate SD. Shaded regions indicate the mean (±95% confidence interval) classifier performance expected by chance (bootstrap randomization procedure). Dashed lines in A and B indicate chance performance.

