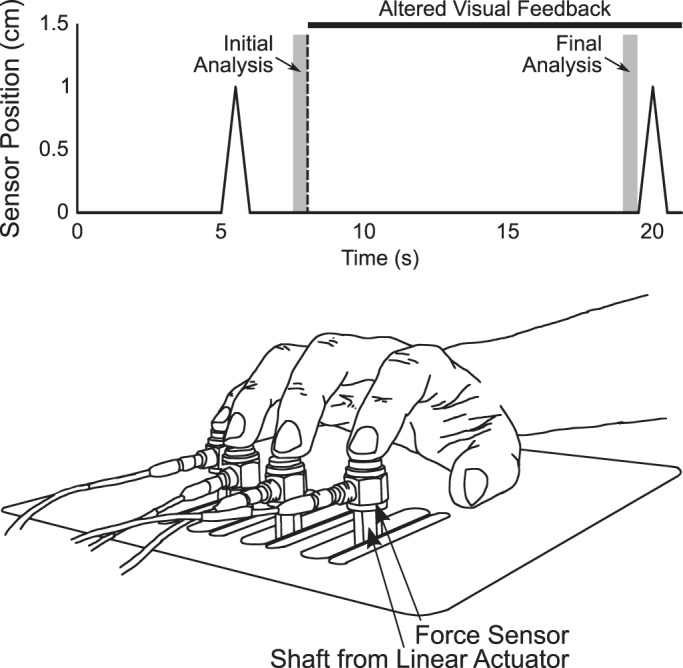
Fig. 1.

Schematic of the sensor motion during the experimental trials (top) and illustration of the inverse piano apparatus (bottom). On the sensor motion illustration, the vertical broken line represents the time at which visual feedback was removed (8 s after trial onset), whereas the two shaded areas indicate the times over which response variables were computed for initial and final comparisons. The inverses piano apparatus is shown with all four fingers raised by means of linear actuators, which are mounted under the table and therefore not visible in the illustration.
