Fig. 7.

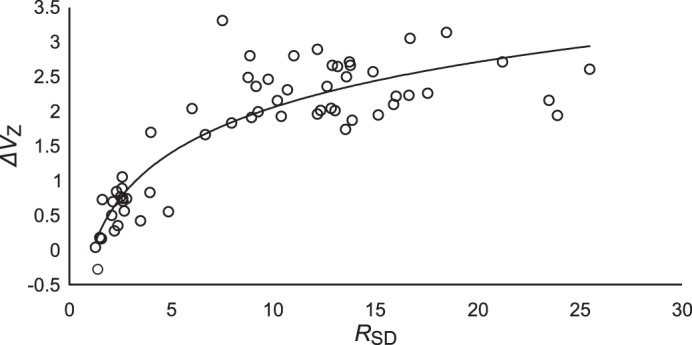
Z-transformed synergy index, ΔVZ, plotted against RSD for all subjects. Each subject contributes 6 values of RSD and ΔVZ to the plot measured before and after feedback was removed across the three feedback conditions.

Z-transformed synergy index, ΔVZ, plotted against RSD for all subjects. Each subject contributes 6 values of RSD and ΔVZ to the plot measured before and after feedback was removed across the three feedback conditions.