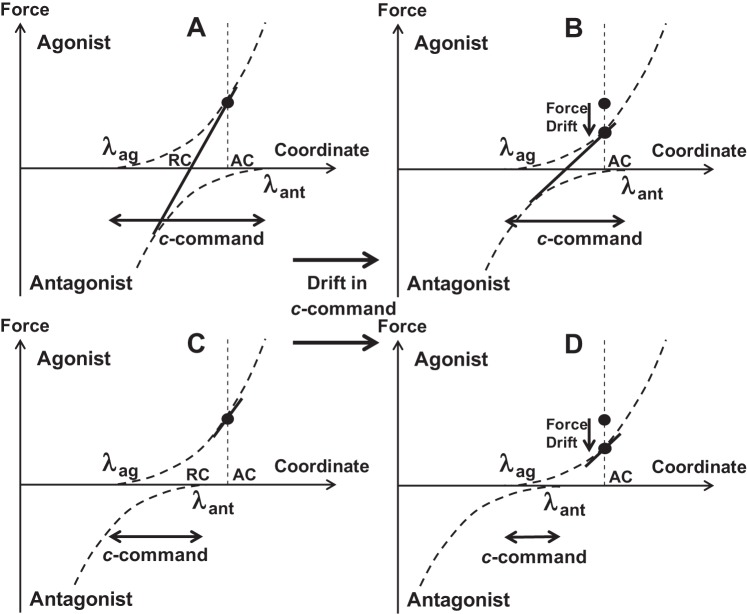
Fig. 8.
Schematic of force-coordinate characteristics for the agonist and antagonist muscle groups (curved broken lines) and for the effector (fingertip, straight solid lines). The neural control of the system may be described with changes in activation thresholds for the opposing muscle groups [activation thresholds for agonist (λag) and antagonist (λant)]. The c-command defines the spatial range where both muscle groups are active. Force production in isometric conditions [actual coordinate (AC)] is shown with black filled circles. If the c-command is large (A), both muscles are active, and the force-coordinate characteristic is close to linear. If the c-command is small (C), only agonist muscles are active, and the force-coordinate characteristic is nonlinear. In both cases, a drift in the c-command (B and D) results in a force drop, a drop in the slope (k) of the tangential line to the force-coordinate characteristic, with or without a change in the referent effector coordinate (RC, midpoint between λag and λant).

