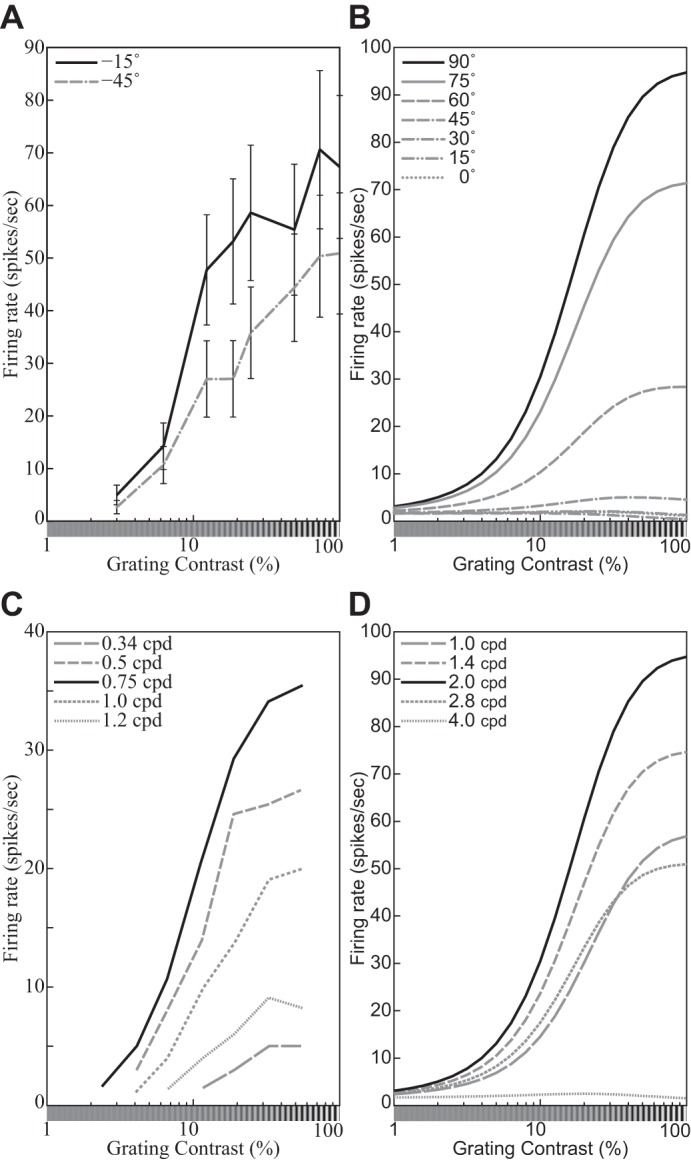
Fig. 3.

Representative contrast response functions (CFs). A: responses of a simple cell to drifting sinusoidal gratings spanning a range of contrasts at 2 orientations (see key). Replotted from Carandini et al. (1997, Fig. 4B, anesthetized macaque; error bars = ±SE). B: CFs of the DNM neuron with default parameters, probed with gratings with the neuron’s preferred frequency (1.0 oct) and orientations shown in key. The size of the stimuli was equal to the measured RF diameter (0.81°). C: responses of a V1 neuron to drifting sinusoidal gratings with the neuron’s preferred orientation and spatial frequencies shown in key. Replotted from Albrecht and Hamilton (1982, Fig. 7A). D: CFs of the divisive normalization model (DNM, defined in text) neuron with default parameters, probed with gratings with the neuron’s preferred orientation (0°) and spatial frequencies shown in key. The size of the stimuli was equal to the measured RF diameter (0.81°). (See phenomena 7, 10, and 11 in Table 1.)
