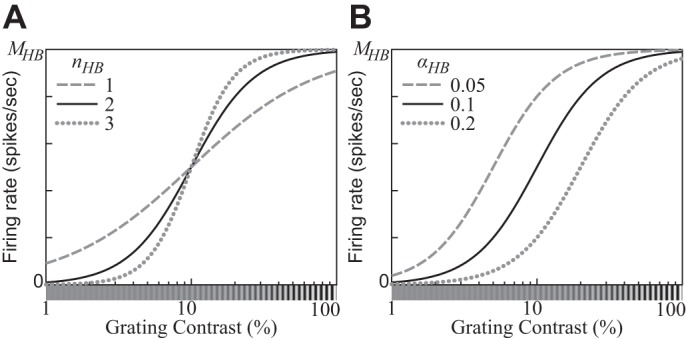
Fig. 4.

Contrast response functions (CFs) produced by the hyperbolic ratio model (Eq. 12). A: the exponent parameter nHB controls the slope of the CF as a function of the log contrast of the stimulus. B: the semisaturation contrast parameter αHB controls the location of the CF. A stimulus with contrast αHB elicits one-half of the saturation level MHB. (αHB = 0.1 for A; nHB = 2 for B.)
