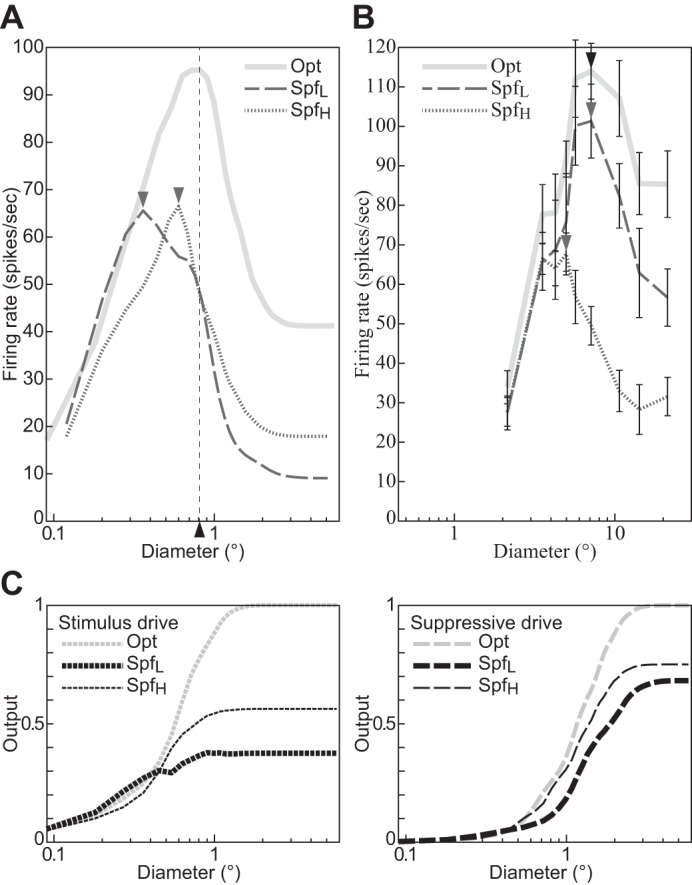
Fig. 8.

The size tuning function depends on the spatial frequency of the stimulus grating. A: divisive normalization model (DNM) complex cell with standard parameters. B: a real V1 neuron (replotted from Osaki et al. 2011, Figs. 2A and 4A, anesthetized cat; error bars = ±SE). C: the stimulus and suppressive drive terms of the DNM equation. The stimulus frequency matched the preference of the respective neuron in the Opt condition, was lower in the SpfL condition, and was higher in the SpfH condition. The side frequencies in A were determined by the half-height points of the DNM frequency tuning curve. See text for details. The data in B were collected with SpfL = 0.10 cpd, Opt = 0.20 cpd, and SpfH = 0.30 cpd (Osaki et al. 2011). All gratings had maximal contrast (c = 1), and their orientation matched the preference of the respective neuron. (See phenomenon 4 in Table 1.)
