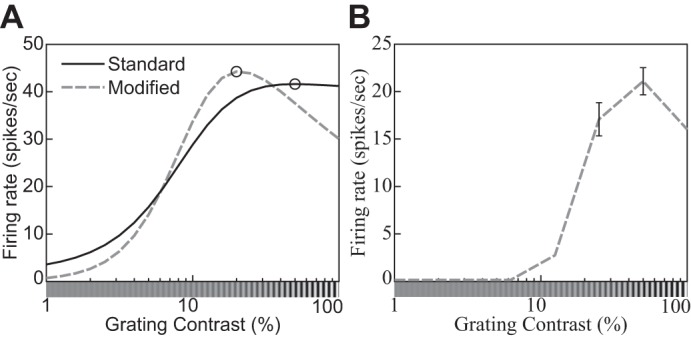
Fig. 10.

An example of the supersaturation effect (phenomenon 8 in Table 1). A: contrast response function of a DNM neuron with standard (solid line) and modified (nd = 2.35, β = 0, M = 30, dashed line) parameterization. The stimulus frequency and orientation matched the DNM preferences. The size of the grating patch was 2.88°. B: contrast response function of a real neuron (replotted from Peirce 2007, Fig. 2e, anesthetized macaque).
