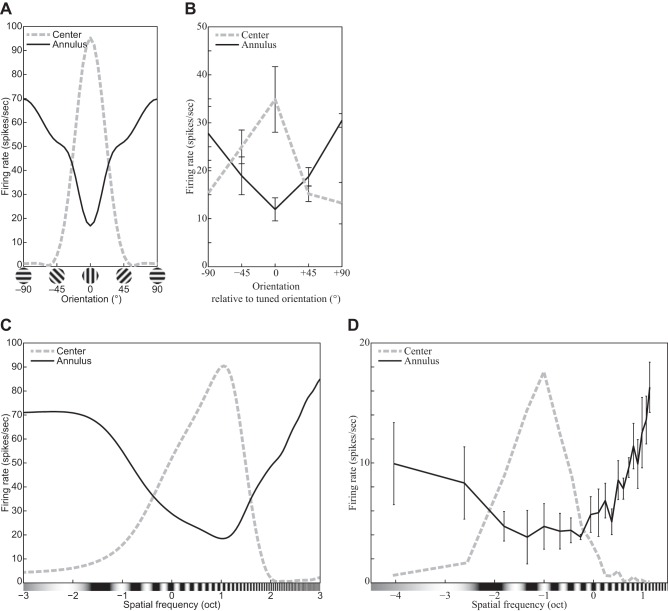
Fig. 19.
The effect of surround suppression on the response of the model neuron with standard parameters (A and C), a V1 complex cell (replotted from Cavanaugh et al. 2002b, Fig. 2B, anesthetized macaque; error bars = ±SE) (B), and a V1 simple cell (replotted from Li and Li 1994, Fig. 7C, anesthetized cat; error bars = ±SE) (D) in the orientation and spatial frequency domains. In all panels, the solid line plots the neuron’s response to a composite stimulus consisting of a center grating and a surrounding annulus, whereas the dashed line plots the standard tuning function as probed with the center alone. x-Axis represents the orientation (A and B) or frequency (C and D) of the surrounding annulus for composite stimuli (solid lines) or that of the center for simple stimuli (dashed lines). A and C: the contrast of the center grating was 100%, and its diameter was 0.81° (the measured RF). The contrasts of the annulus grating were 100% and 5.76°. The frequency of the center and annular gratings was 2.0 cpd for A. Their orientation was 0° for C. (See phenomena 24 and 25 in Table 1.)

