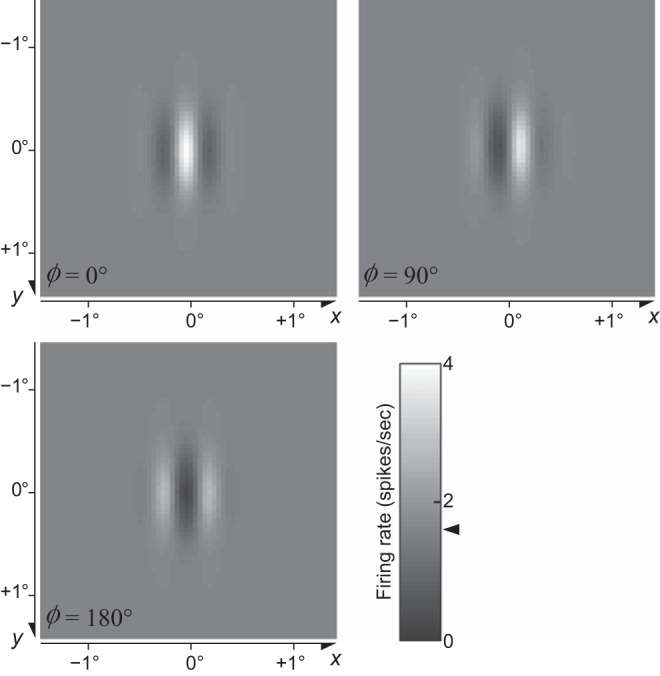
Fig. 23.

Receptive field maps obtained with a light spot as a probe for 3 divisive normalization model (DNM) simple cells (standard parameters) with different phases ϕ. Grayscale levels indicate firing rates. Maintained discharge (the response to a uniform gray field) was the same for the 3 cells and is indicated by arrowhead on color bar. The size of the light-spot probe was 0.045° × 0.045° (1 pixel). Stimulus background was uniform gray, and luminance of the spot was twice as high as the background gray. (See phenomenon 28 in Table 1.)
