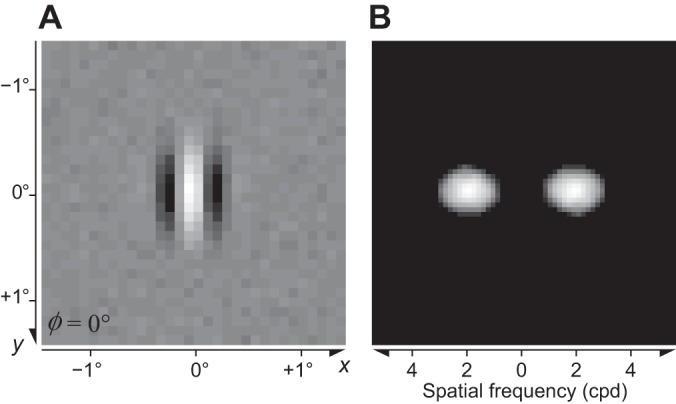
Fig. 24.

A: the receptive field of a divisive normalization model (DNM) simple cell (standard parameters) obtained via the reverse correlation method. Brighter and darker regions represent bright- and dark-excitatory regions, respectively. B: 2D Fourier spectrum energy distribution of the RF pattern in A. The stimuli were 32 × 32 mosaics of random luminance spots (white noise). Size of the stimuli was 2.88°, and that of the spots was 0.090° (2 × 2 pixels). (See phenomenon 29 in Table 1.)
