Fig. 25.

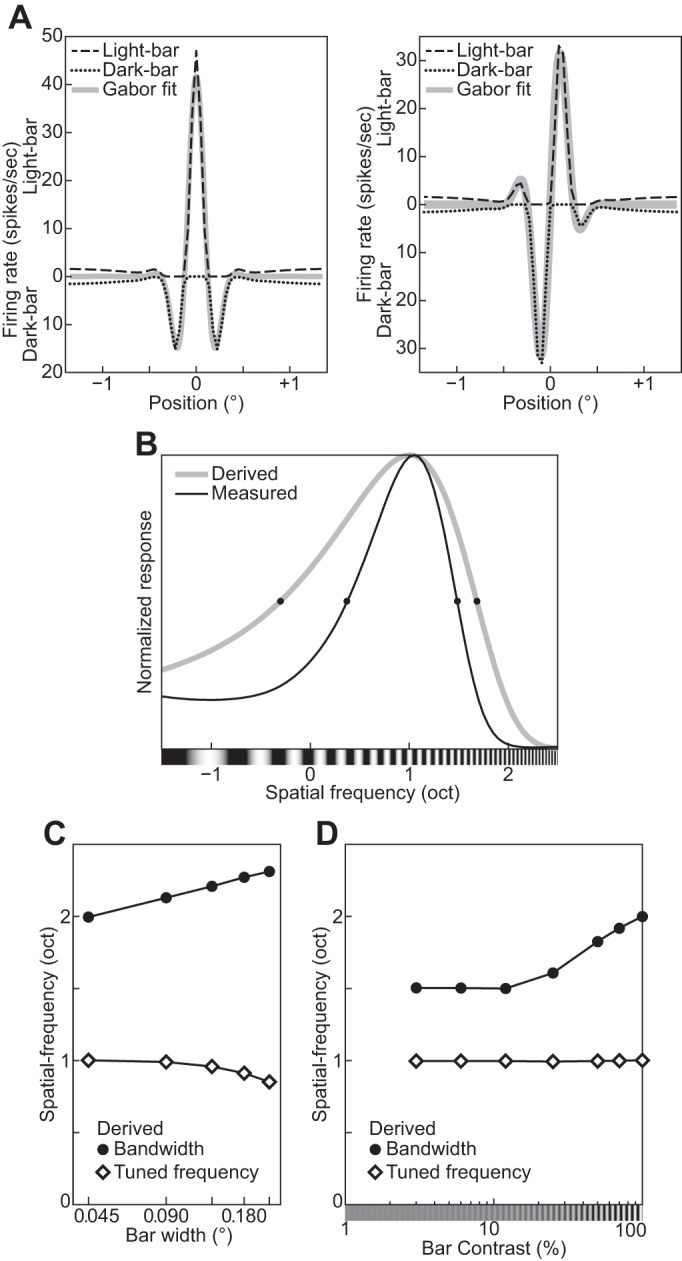
A: measured 1D distributions of the responses to light and dark bars parallel to the tuned orientation of the divisive normalization model (DNM) simple cells with different phases Φ: 0° (left) and 90° (right). x-Axis represents positions of the bars along an orientation perpendicular to the tuned orientation. Top half of the graph is for the light bar, and bottom half of the graph is for the dark bar. The best-fitting 1D Gabor pattern is superimposed (in gray) for comparison. The background of the stimulus was uniform gray, and the luminance of the bars was 0 (dark) or twice as high as the background gray (light). The width of the bars was 0.045° (1 pixel). B: spatial-frequency tuning functions of the DNM simple cell derived (gray line) from the 1D pattern of its RF in A and measured (black line) with a grating. C: effect of the width of the bars on the tuned spatial frequency derived from the measured RF as in A. D: effect of the contrast of the bars. (See phenomenon 30 in Table 1.)
