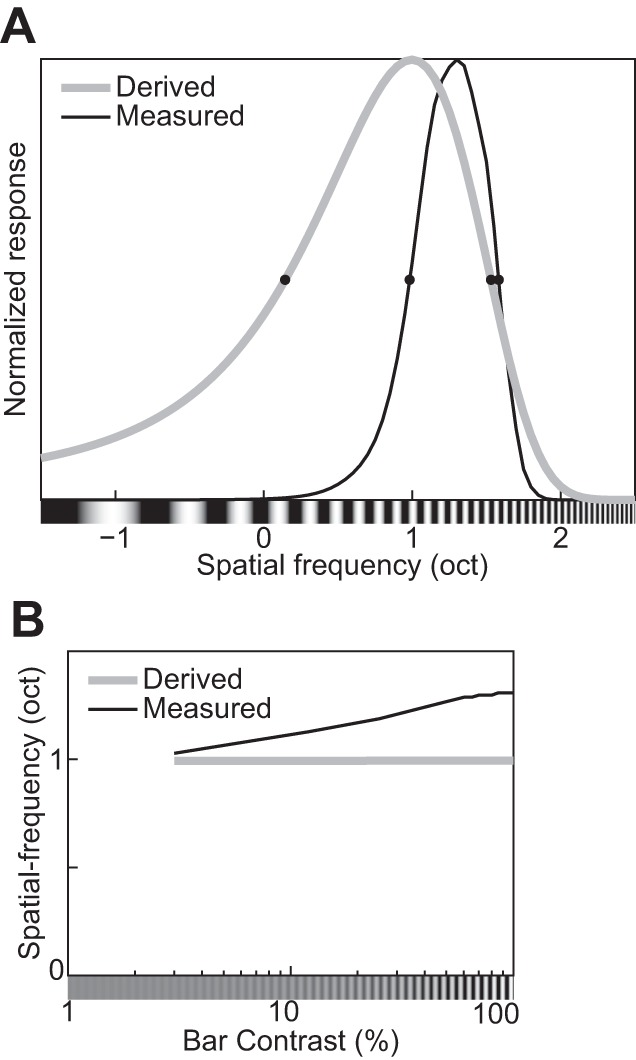
Fig. 27.

Two alternative procedures for estimating the spatial-frequency tuning function yield diverging results for the augmented divisive normalization model (DNM) neuron (in which the standard Eq. 20 is replaced with Eq. E3). The first procedure (black lines) measures the frequency tuning directly with gratings. The second procedure (gray lines) derives the frequency tuning indirectly via the Fourier transform of the neuron’s receptive field probed with light and dark bars (see phenomenon 30 in Table 1, receptive fields of simple cells, and Fig. 25B). A: spatial-frequency tuning functions obtained via the direct (Measured) and indirect (Derived) procedures. Contrasts of the grating and the bars were 100%. B: effect of the contrasts of the grating and the bars on the peak frequencies of the derived and measured frequency tuning functions.
