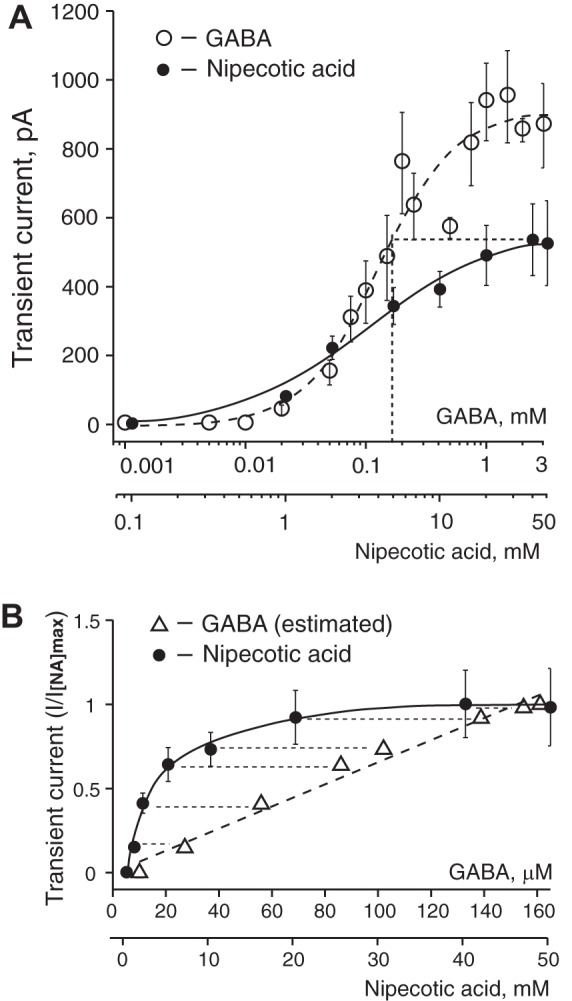
Fig. 3.

Concentration dependence of transient currents induced by GABA and NA, and relationship between NA-activated currents and estimated extracellular GABA concentrations. A: concentration dependence of transient currents induced by GABA and NA. The transient current at a saturating NA concentration has the same magnitude as the current induced by 160 µM GABA (shown on x-axis by dotted vertical line). Concentrations of GABA and NA are shown on a log scale. Data are means ± SE. The number of neurons (n) recorded for each GABA concentration was n = 3 (1–10 µM), n = 5 (20 µM), n = 11 (50 µM), n = 7 (75 µM), n = 12 (100 µM), n = 7 (150 µM), n = 7 (200 µM), n = 15 (250 µM), n = 8 (500 µM), n = 10 (750 µM), n = 11 (1 mM), n = 10 (1.5 mM), n = 5 (2 mM), and n = 8 (3 mM). The NA concentration-response data are the same as in Fig. 2B. B: transient GABAAR-mediated currents with the same amplitude demonstrated different dependence on the GABA or NA concentrations in the range up to the maximal current induced by NA (I[NA]max) and are shown as I/I[NA]max. Over the indicated range of amplitudes, the transient currents induced by GABA and NA showed linear and nonlinear concentration dependence, respectively. Each data point on the graph matches GABA or NA concentrations that induced the same transient current amplitude. Concentrations of GABA that induced current the same amplitude as NA were estimated from the concentration-response curve for GABA. Currents with the same amplitude are connected with thin dashed lines. Concentrations of GABA and NA are shown on a linear scale.
