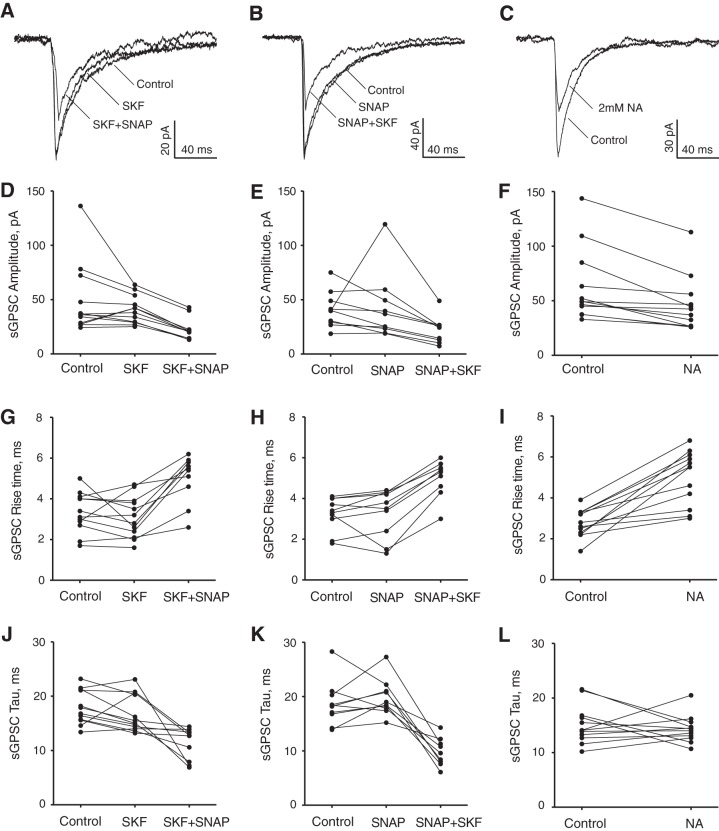
Fig. 6.
Effect of GAT1 and GAT3 inhibitors on sGPSC recorded in the SCN. A–L: changes in sGPSC parameters during single or joint SKF-89976A (SKF; 100 µM) and SNAP-5114 (SNAP; 100 µM) or nipecotic acid (NA; 2 mM) application. A, D, G, J: control, SKF (n = 12), and SKF+SNAP (n = 10). B, E, H, K: control, SNAP (n = 10), and SNAP+SKF (n = 9). C, F, I, L: control and NA (n = 12). A–C: sGPSC recordings (each trace represents the average of 10 sGPSC recorded at each condition). D–F: amplitude. G–I: rise time (10–90%). J–L: decay time constant (tau). The sGPSC parameter changes between conditions are shown on the line graphs, which represent mean data for each recorded neuron (SE, which ranged from 4 to 6% of the mean, is not shown to make image clearer).

