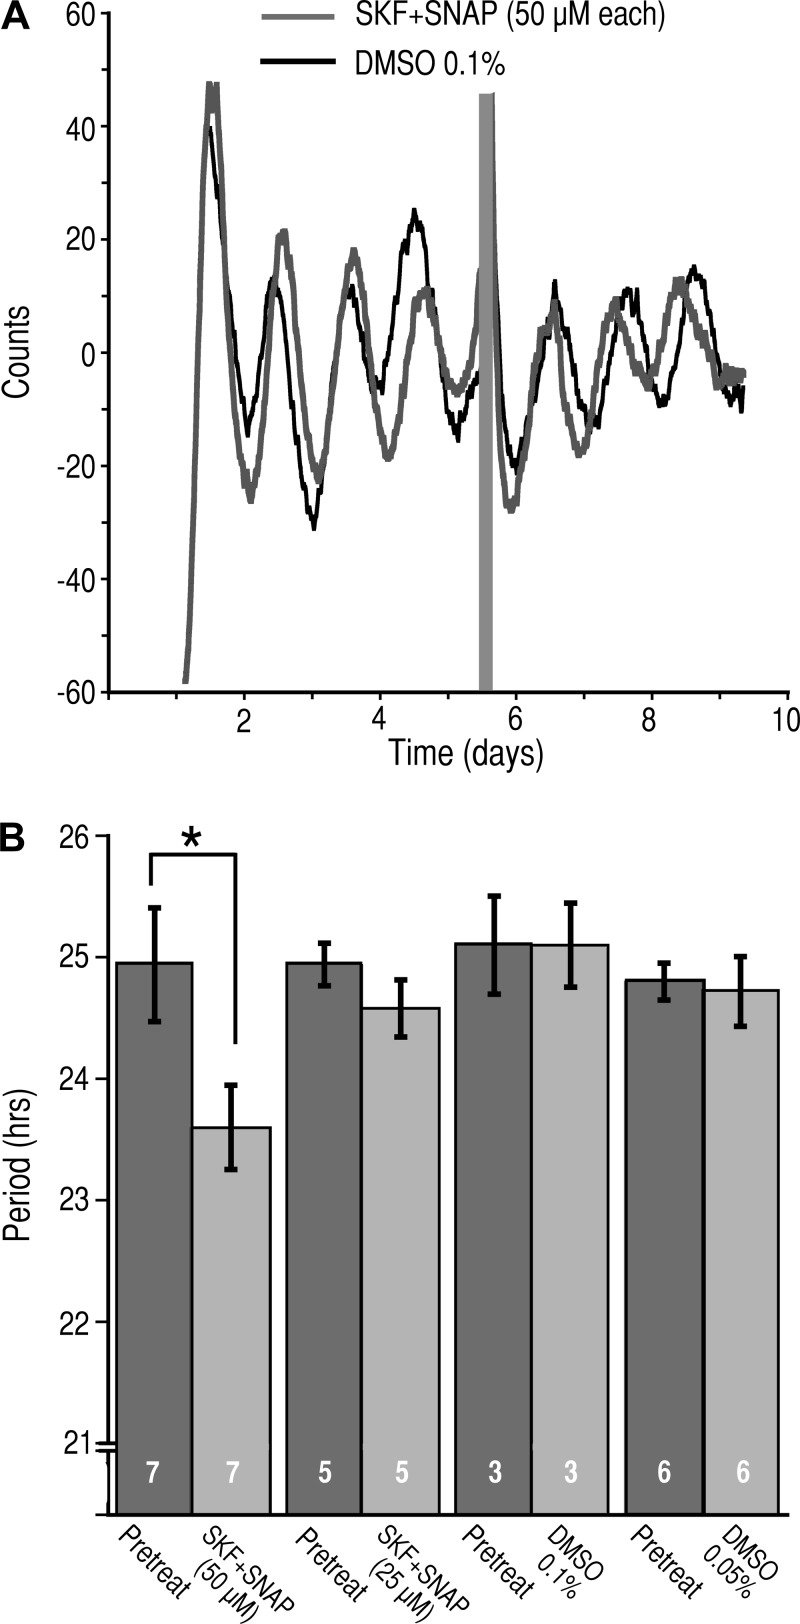
Fig. 10.
Inhibition of GAT1 and GAT3 alters the circadian period of Per1 expression. A: representative bioluminescent records from the SCN of Per1:Luc cultured brain slices before and after application of SKF-89976A and SNAP-5114 (SKF+SNAP, 50 µM each; gray trace) or vehicle (DMSO, 0.1% final; black trace). The gray bar indicates the duration of application of the test agents. B: histogram of the circadian periods (means ± SE) measured before, during treatment with DMSO (0.1%), or during coapplication (SKF+SNAP, 50 µM each). *P < 0.021, paired t-test. Numbers in bars indicate number of neurons recorded.

