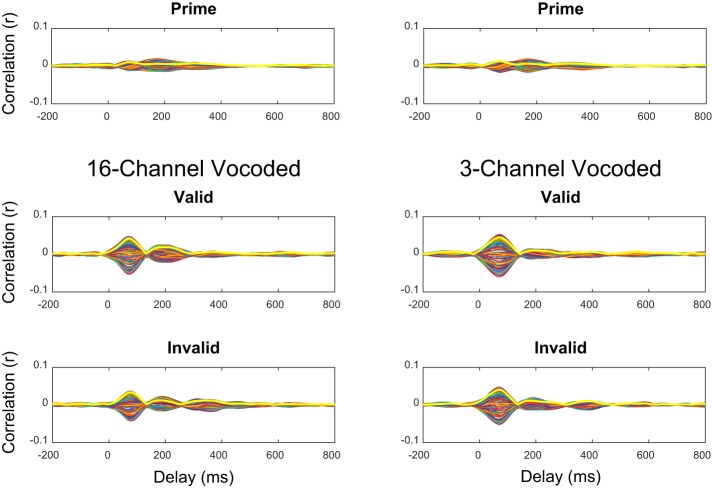
Fig. 2.
Grand-averaged cross-correlation functions [bandpass-filtered envelopes (1–50 Hz) were cross-correlated with the EEG recorded from that trial] for the natural speech cues and the vocoded targets. Thick yellow lines indicate the time course of the ROI. The only prominent peak in these functions is contained within a latency range of ~25 to ~125 ms.

