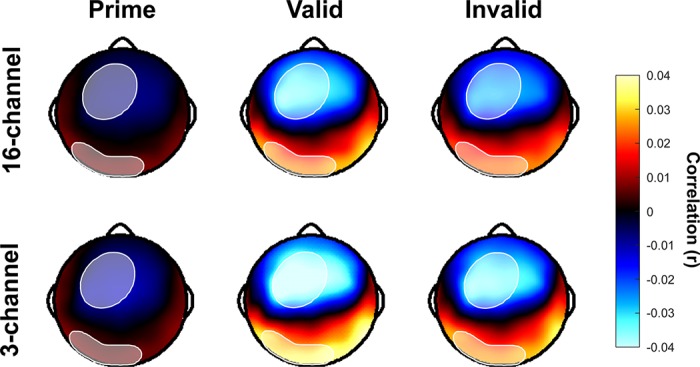
Fig. 3.

Scalp topographies for the latency window of interest (25–125 ms). EEG was recorded with a 128-channel electrode cap and sampled at 1,000 Hz with an online average reference. The recordings were then bandpass filtered from 1 to 50 Hz. Thirty channels that showed the largest (regardless of polarity) cross-correlations were selected from the grand average for each of the 6 conditions and were combined to form an ROI of 44 channels, indicated by the shaded region.
