
Fig. 5.
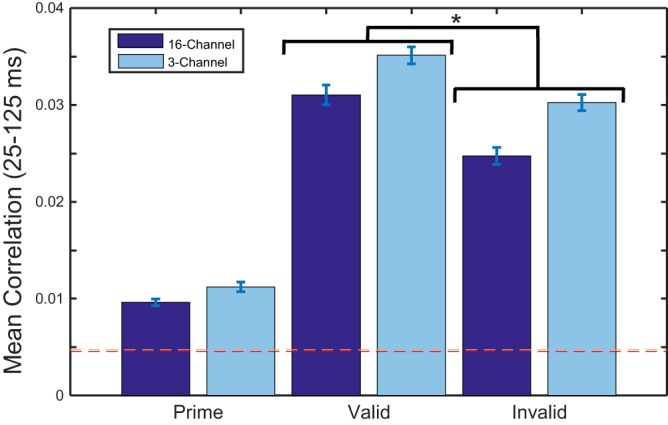
Bar plots showing mean correlation values over the latency window (25–125 ms) and averaged across subjects. The bootstrapped noise floors (99th percentile cutoffs) are displayed as dotted lines (16-channel, red/dark; 3-channel, pink/light). A 2-factor repeated-measures ANOVA revealed a significant effect of valid vs. invalid [F(1, 12) = 13.6, *P = 0.03] but no significant effect of 16- vs. 3-channel vocoding [F(1, 12) = 2.7, P = 0.126] and no significant interaction [F(1, 12) = 0.14, P = 0.714]. Post hoc t-tests revealed a robust difference between the natural speech cue and the vocoded targets (all P < 0.005). This suggests that task demand may play a crucial role in determining the strength of the entrainment response.