
Figure 2.
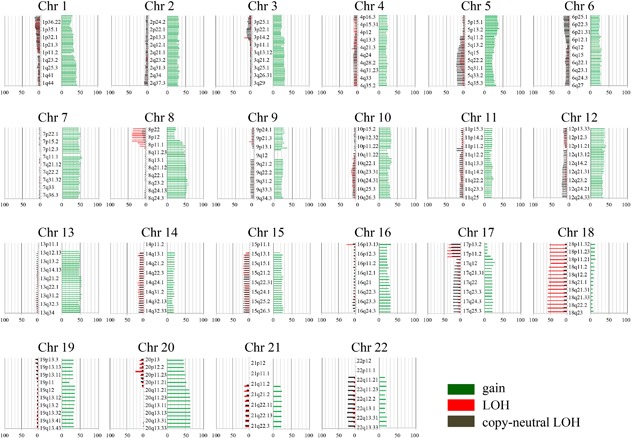
Ideogram of copy number alterations in 106 colorectal cancers specimens. Chromosomes are ordered from 1 to 22. The colored horizontal lines represent the frequencies of gains, LOHs, and CNLOHs. Lines on the left indicate losses (red, copy neutral LOH; gray, LOH), and those on the right (green) indicate gains