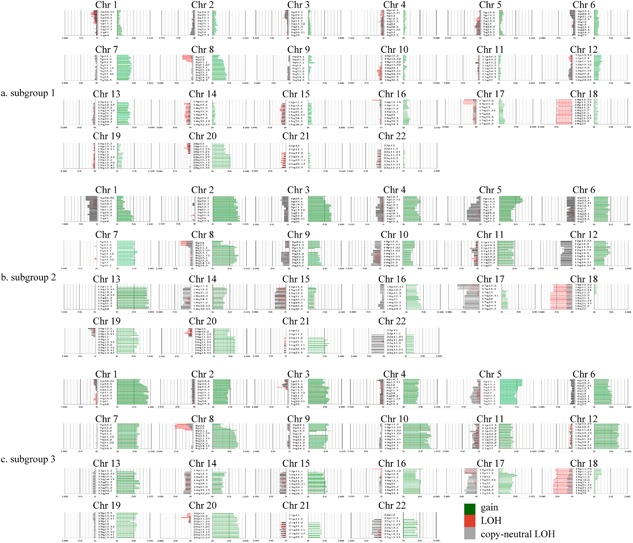
Figure 3.

Ideogram of copy number alterations in three subgrouops categorized based on copy number alteation pattern. Chromosomes are ordered from 1 to 22. The colored horizontal lines represent the frequencies of gains, LOHs, and CNLOHs. Lines on the left indicate losses (red, copy neutral LOH; gray, LOH), and those on the right (green) indicate gains. A, Ideogram of copy number alterations in subgroup 1. B, Ideogram of copy number alterations in subgroup 2. C, Ideogram of copy number alterations in subgroup 3
