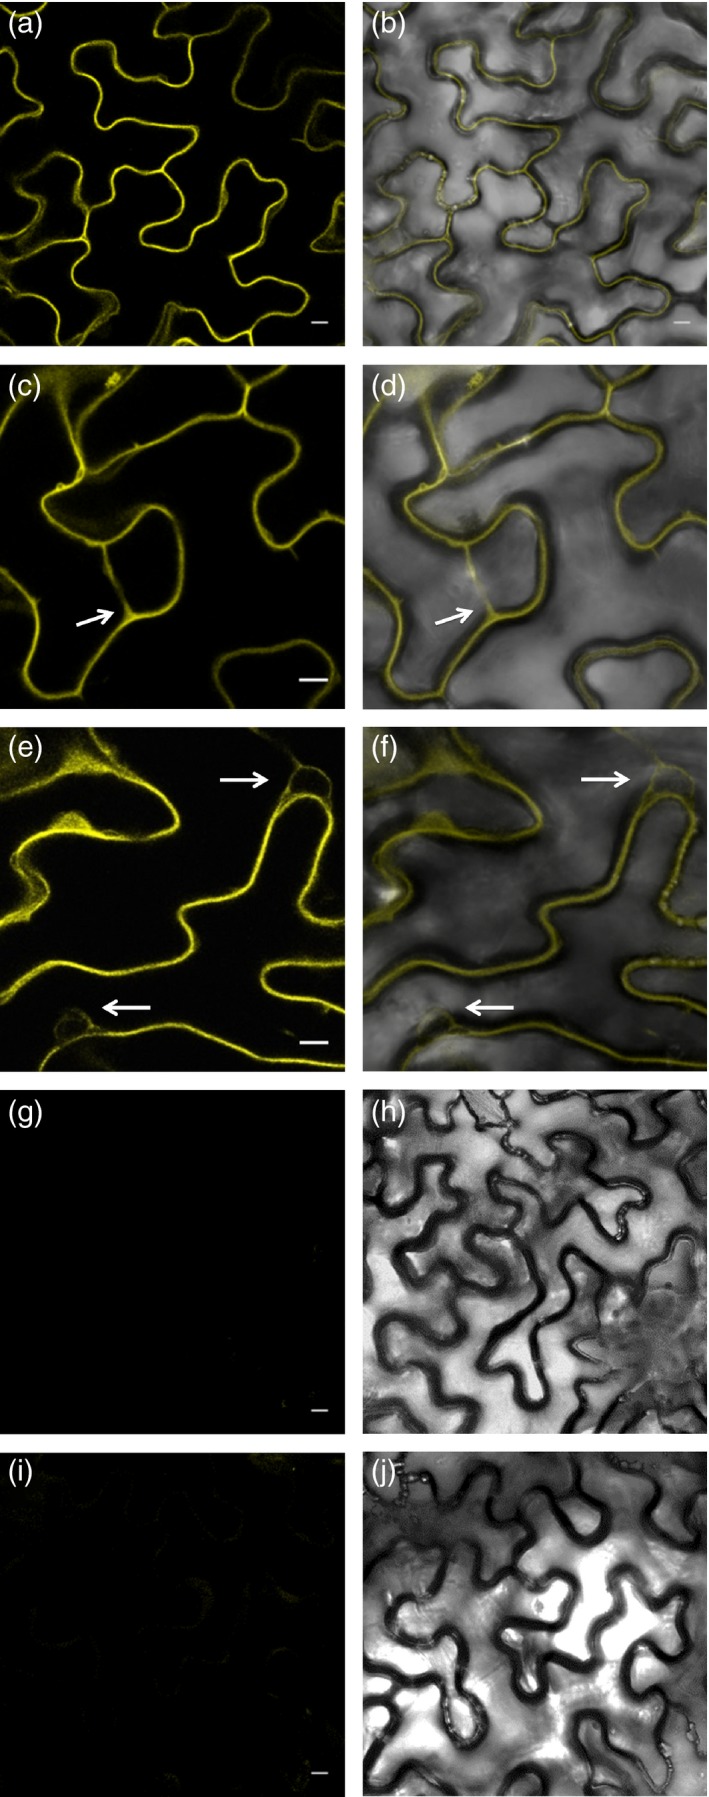
Figure 6.

SOS2‐GRIK1 interaction visualized by bimolecular fluorescence complementation (BiFC).
Panels from (a) to (f) show several images of reconstituted BiFC by GRIK1‐SOS2 interaction (left: fluorescence images; right: overlay with transmitted light). Arrows indicate the presence of a transvacuolar strand in (c) and (d), and nuclei in (e) and (f). Panels (g) and (h) show a negative control with GRIK1 in pSPYCE(M) and the empty vector pSPYNE(R)173. Panels (i) and (j) show co‐transformation with SOS2 in pSPYNE(R)173 and the empty vector pSPYCE(M). Scale bar: 10 μm.
