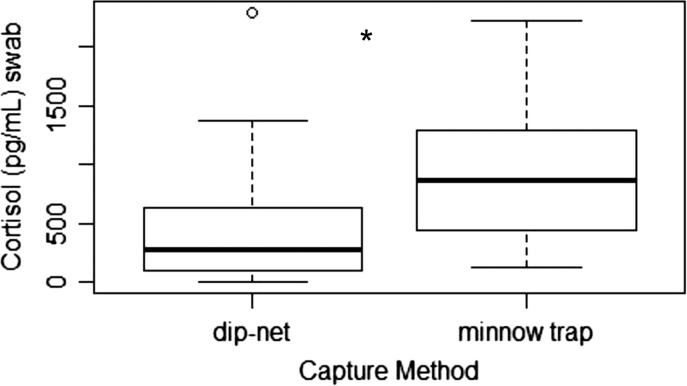
Figure 3:
Box plot of cortisol (pg/ml swab) from northern leopard frogs (Lithobates pipiens) captured in the field using a dip-net or found in minnow traps set the previous day. Bold line is the median and open circles are suspected outliers. Asterisks indicates a difference (P < 0.001) in cortisol concentrations between trapping methods

