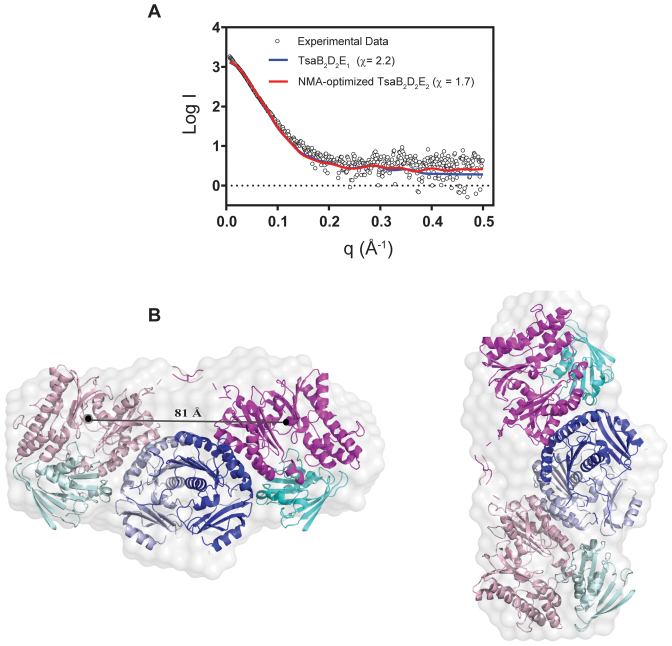
Figure 4.
The SAXS solution structure of the TsaB2D2E2 complex. (A) Comparison of the solution scattering data (black circles) to the theoretical scattering curves calculated from various attempted structural models (colored lines). The chi values for the various models are listed. (B) The averaged ab initio reconstruction of the TsaB2D2E2 molecular envelope calculated from the SAXS data and overlaid on the ribbon diagram of the NMA-optimized model. The TsaB, TsaD and TsaE subunits are colored in two shades of blue, magenta and cyan, respectively. The distance between the centers of mass of the two TsaD subunits is shown.

