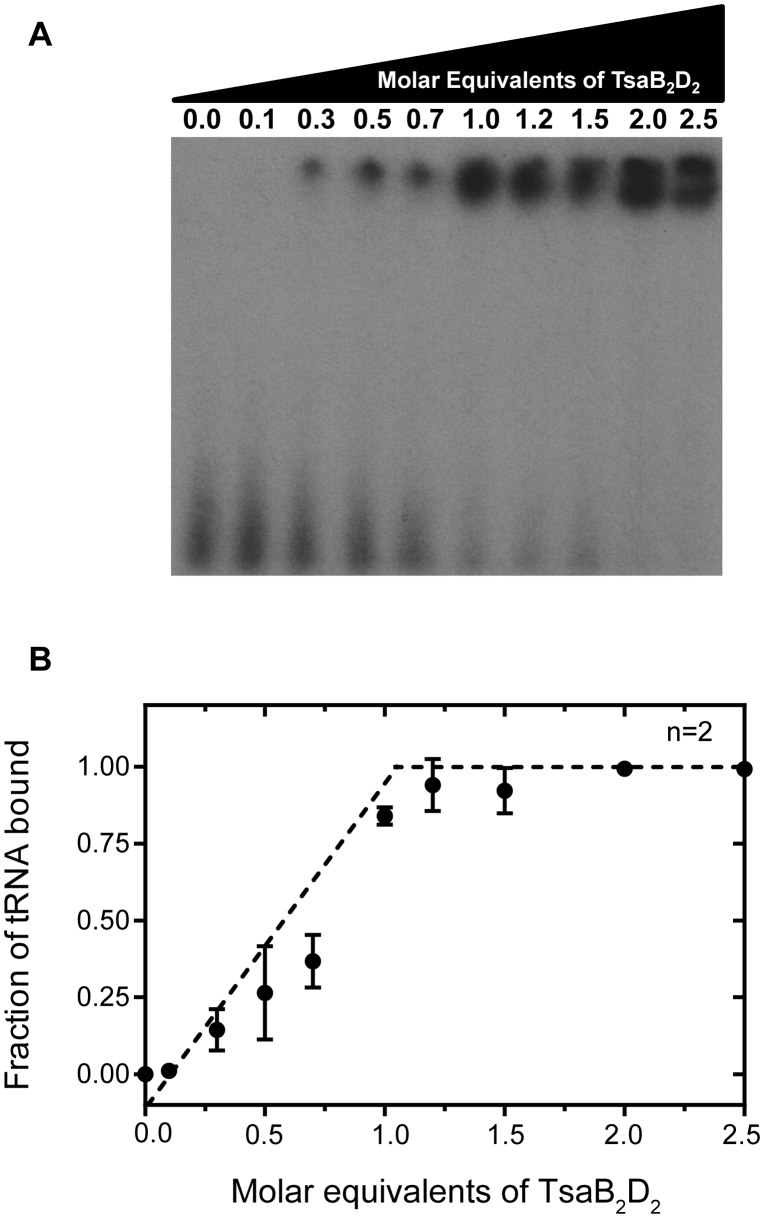
Figure 6.
Stoichiometry of tRNA binding to TsaB2D2. (A) EMSA gel showing band shift corresponding to the TsaB2D2/tRNA complex with increasing molar equivalents of TsaB2D2. (B) Plot of fraction of tRNA bound quantified as the ratio of upper-band density to total density in each lane, as a function of the molar equivalents of the protein incubated with tRNA.

