Figure 2.
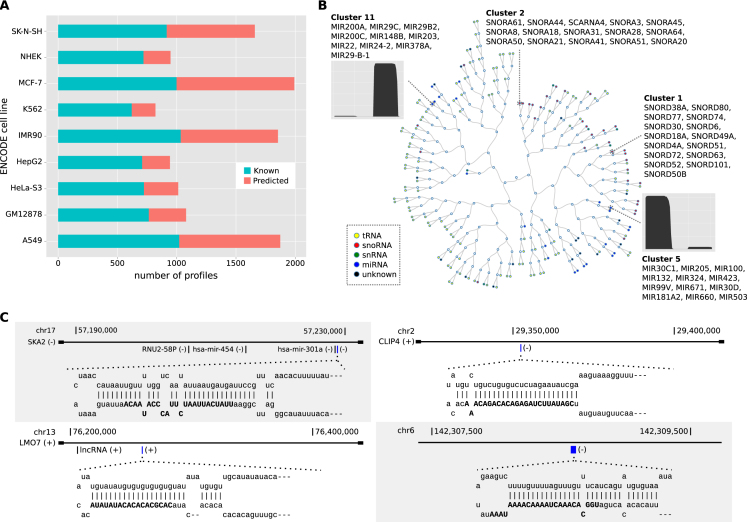
Extended annotation derived from ENCODE cell lines. (A) Number of known and novel sncRNAs across 9 ENCODE cell lines. (B) Hierarchical clustering representation of the clusters obtained for the NHEK cell line. Distance between clusters is calculated by averaging all the distances between profiles from both clusters. Colored circles represent clusters of sncRNAs at the leaves of the tree labeled by class. Empty circles represent internal nodes of the tree. The read profiles in clusters 5 and 11 are for one of its members, for which we plot the number of reads per nucleotide in the sncRNA. (C) Genomic loci and graphical representation of the hairpins for four predicted novel miRNAs. The predicted mature miRNAs are highlighted in blue in the corresponding gene locus: miRNA chr17:57228820–57228919:− (upper left) at the SKA2 locus, miRNA chr2:29352292–29352349:− (upper right) at the CLIP4 locus, miRNA chr13:76258915–76258974:+ (lower left) at the LMO7 locus, and miRNA chr6:142308575–142308638:− (lower right) at an intergenic region.

