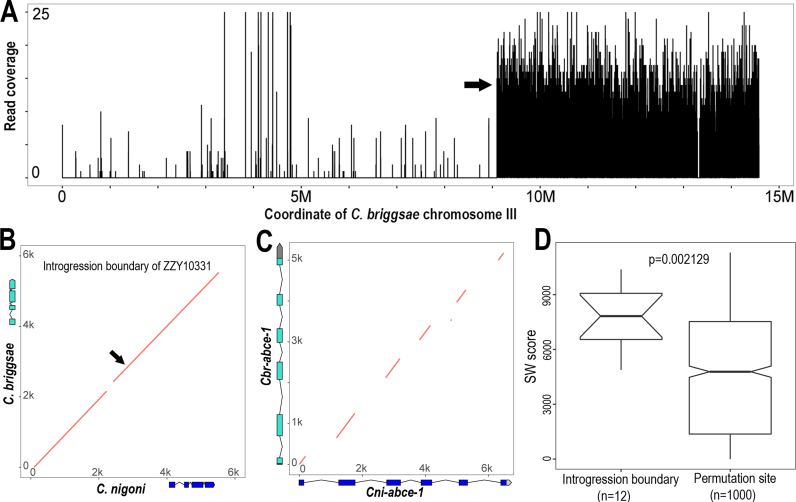
Figure 6.
Conservation of sequences flanking recombination site between C. briggsae and C. nigoni. (A) The left and right boundaries of an introgression (ZZY10331) were mapped onto the right arm of C. briggsae chromosome III by NGS. Shown is the coverage of sequencing reads (Y axis) derived from hybrid mapped against C. briggsae chromosome III (X axis). The left boundary is indicated with an arrow and the right boundary is mapped to the very end of the chromosome. (B) Dotplot of the 6-kb syntenic sequences flanking the recombination site (indicated with arrow) between C. briggsae and C. nigoni. Gene models within the region are shown in scale. (C) Dotplot of the 6-kb homologous sequences spanning the genomic regions of a highly conserved gene, abce-1 between C. briggsae and C. nigoni. abce-1 gene models are shown in scale for both species. Note that only exons are conserved. (D) Boxplot of alignment scores for the 6-kb syntenic genomic DNAs of recombination regions (left) or randomly sampled genomic regions (right). SW score, Smith–Waterman alignment score.

