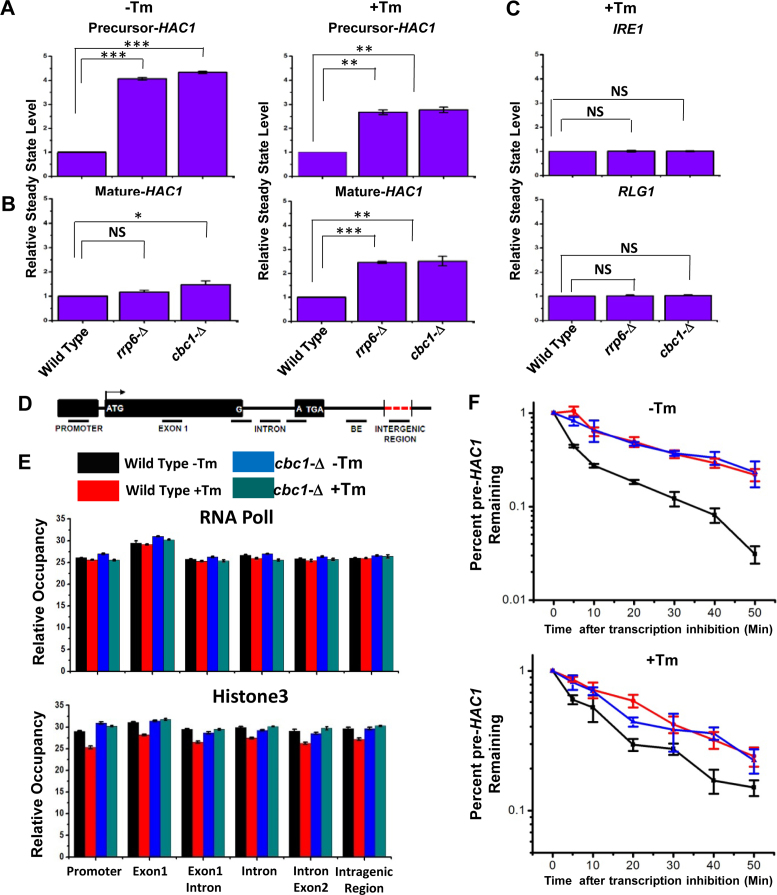
Figure 3.
Elevated levels of UPR activity in rrp6-Δ and cbc1-Δ strains is accomplished by the selective and targeted decay of pre-HAC1 mRNA by the nuclear exosome and DRN. Histogram showing the steady state levels of pre-HAC1 (A) and mature HAC1 (B) transcripts in the absence (–Tm) and the presence of 1 μg/ml tunicamycin (+Tm) in a normal, cbc1-Δ, and rrp6-Δ strains (n = 3). Three independent cDNA preparations (biological replicates, n = 3) were used to determine the levels of these mRNAs. Normalized value of individual mRNA from normal samples was set to 1. (C) Histogram depicting the abundance of IRE1 and RLG1 mRNAs in the presence of 1 μg/ml tunicamycin (+Tm) in indicated strains as determined from three independent experiments (n = 3). Three independent cDNA preparations (biological replicates, n = 3) were used to determine the levels of these mRNAs. Normalized value of individual mRNA from normal samples was set to 1. (D) Schematic presentation of HAC1 genomic locus (not up to the scale) showing the location of different primer pairs used to determine the RNA PolII and Histone H3 occupancy as well as the exon 1 and BE specific amplicons for experiment described in Figure 4A and B. (E) Histogram depicting the relative occupancy of RNA Pol II and Histone H3 at different regions along HAC1 genomic locus in a normal (–Tm, black bar and +Tm, red bar) and cbc1-Δ strains (–Tm, blue bar and +Tm, green bar) using chromatin immunoprecipitation (ChIP) technique using specific antibodies against RNA Pol II and Histone H3. Mean ChIP signal obtained from three independent experiments (biological replicates) is presented as means ± SE (n = 3 for each strain). (F) The decay rate of pre-HAC1 mRNA in a Wild type (black line), rrp6-Δ (red line) and cbc1-Δ strains (blue line) in absence and presence of 1 μg/ml tunicamycin at 30°C. Decay rates were determined from three independent experiments (biological replicates) by qRT-PCR analysis (using primer sets of HAC1 intronic sequences) and the intronic signals were normalized to SCR1 RNA and normalized signals (mean values ± SD) were presented as the fraction of remaining RNA (with respect to normalized signals at 0 min) versus time of incubation in the presence of 1,10-phenanthroline. The statistical significance of difference as reflected in the ranges of p-values estimated from Student's two-tailed t-tests for a given pair of test strains for each message are presented with following symbols, ∗P < 0.05, ∗∗P < 0.005 and ∗∗∗P < 0.001, NS, not significant.

