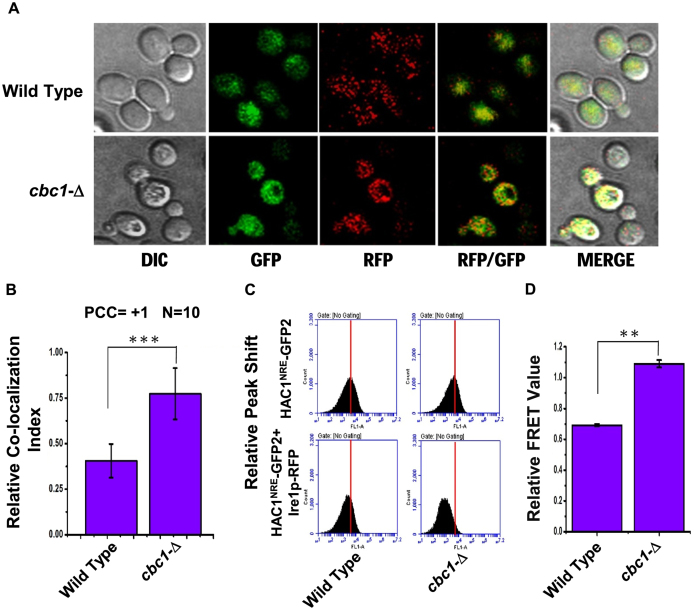
Figure 6.
Precursor HAC1 mRNA is recruited more efficiently to Ire1p foci in DRN deficient cbc1-Δ strains due to the diminished decay of its 3′-BE. (A) Localization of Ire1p-RFP and HAC1NRE mRNA decorated with NRE-GFP following the induction of ER stress by 1 μg/ml tunicamycin in a wild type and cbc1-Δ strain. The images were captured and processed as described in Materials and methods. (B) Histogram depicting the co-localization of HAC1NRE-GFP-nucleolin mRNA into Ire1p-RFP foci at 10 minutes after ER stress by 1 μg/ml tunicamycin in a wild type and cbc1-Δ strain. Co-localization index for HAC1NRE-GFP-nucleolin recruitment into Ire1 foci was expressed in arbitrary units. Means and standard error of the mean were determined from n = 17. Co-localization index (Pearson correlation coefficient, PCC) were determined as described in the method section. (C) Relative fluorescence resonance energy transfer (FRET) between HAC1-GFP-nucleolin and Ire1p-RFP in a wild type and cbc1-Δ strain. The bottom panel shows the quenching of donor HAC1- GFP-nucleolin mRNA in the presence of Ire1p-RFP (acceptor) in normal and cbc1-Δ strains. The top panel is the negative control of this experiment showing no donor (HAC1-GFP-nucleolin) quenching in the absence of Ire1p-RFP in these strains. (D) Histogram depicting the Relative FRET value (in arbitrary units) from donor HAC1NRE-GFP-nucleolin mRNA into Ire1p-RFP foci at 10 minutes after ER stress by 1 μg/ml tunicamycin in a normal and cbc1-Δ strain. Donor (HAC1NRE-GFP-nucleolin mRNA) quenching as an indicator of relative FRET value was measured for HAC1NRE-GFP-nucleolin recruitment into Ire1p foci. Means and standard error of the mean were determined from n = 5 (biological replicates). Donor quenching was determined by Flow Cytometry from 50 000 cells of each strain were determined as described in the method section using BD Accuri™ C6 software. The statistical significance of difference as reflected in the ranges of P-values estimated from Student's two-tailed t-tests for a given pair of test strains for each message are presented with following symbols, ∗P < 0.05, ∗∗P < 0.005 and ∗∗∗P < 0.001, NS, not significant.

