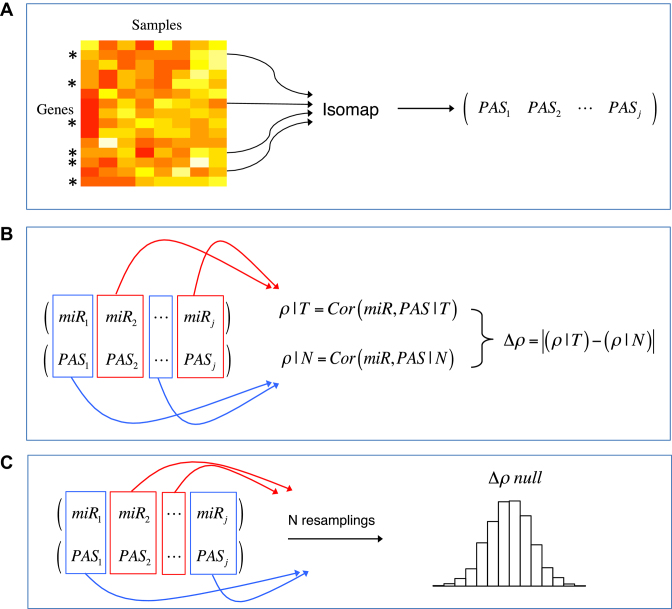
Figure 2.
Illustration of the algorithm for a particular miRNA-pathway pair. (A) Gene expression data is first subsetted by the genes in a pathway and summarized by Isomap to produce the PAS, a one-dimensional (1D) summary of pathway expression in all samples. (B) PAS and miRNA expression are subsetted by phenotype, and miRNA-pathway correlations are computed for tumor and normal tissue. The difference between correlations gives Δρ. (C) To assess Δρ significance, the Δρ null distribution is estimated by random permutation of the class labels.

