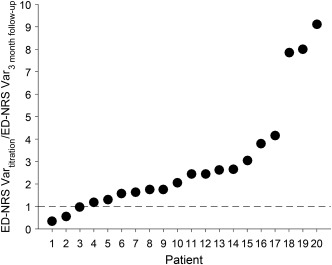
Figure 6.

Comparison of variance in ED‐NRS during titration and three month follow‐up. Each symbol represents one patient's variance during titration (ED‐NRS Vartitration) divided by variance during the three month follow‐up (ED‐NRS Var3 month follow‐up). The patients are ordered in increasing ratio of ED‐NRS Vartitration to ED‐NRS Var3 month follow‐up. Seventeen of 20 patients had larger variance in ED‐NRS during titration, indicating that ED‐NRS was more stable on the optimal setting used during three month follow‐up.
